
Weekly Macro: The Re-Return of Commodities
02/07/2021

THIS IS NOT INVESTMENT ADVICE.
Please speak with a registered investment advisor or other qualified financial professional before making any investment decisions.
Commentary
Underneath the headlines regarding meme-stocks and the runaway rally in the stock market has been a significant improvement in the COVID situation America. The number of people hospitalized with COVID in the US has declined rapidly to 92,880, approximately 40,000 lower than the peak hospitalization rate that was recorded on Jan 5th. As of Jan 31st, 25.2mln Americans had received at least one vaccine dose - that represents approximately 7.5% of the population. Some estimates show that approximately 22% of the 65 & older population of the country has received at least one dose, 8 points higher than the prior week. 49 out of 50 states saw a decrease in hospitalizations. The outlier, Vermont, saw a one-person increase in hospitalization
The most recent data showed that the daily dose rate was approximately ~0.4% of the population, a 60% improvement versus 2 weeks prior.
At the current pace, more than half of the 65+ population will have received a first vaccine dose by the end of February.
Already, high frequency data reflecting activity in the travel, leisure and hospitality industries has shown a bump in engagement and spending.

Chart of the Week

If you would like to receive the Weekly Macro Summary directly to your mailbox every Sunday, please subscribe. It’s free.
ECONOMIC DATA
Nonfarm Payrolls Total +49k in January, weaker than consensus estimates for +105k. Revisions for past months were also disappointing at -159k. Unemployment rate fell to 6.3% from 6.7% but only because the labor force shrunk to 61.4% from 61.5% in December.
Private +6k, Goods -4k, Services +10k, Gov +43k.
Leisure & hospitality -61k jobs in January after -536k loss in December.
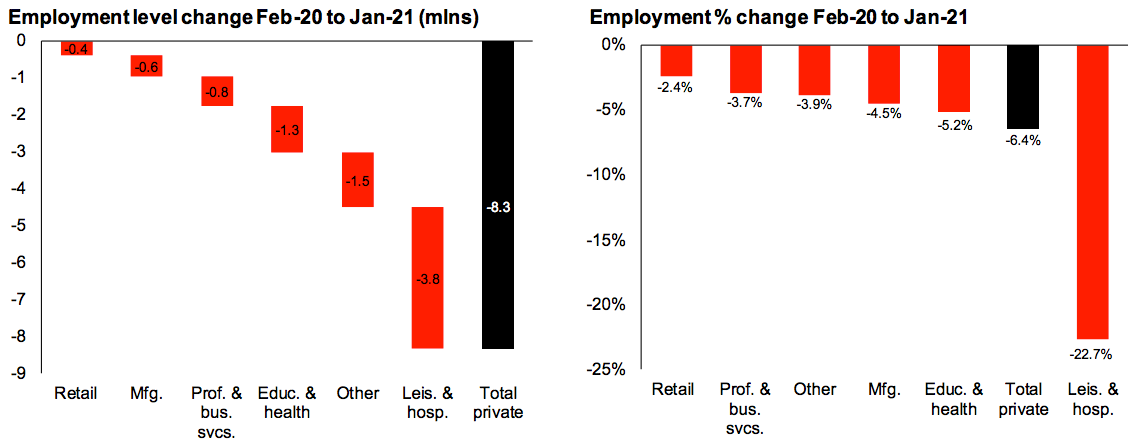
Job loss relative to February 2020 stands at 9.9mln which means that the US has only regained 56% of the COVID job losses.
“The workweek lengthened by 0.3 hours. As a result, aggregate weekly payrolls, a proxy for total wage and salary income, jumped 1.1%, the fastest pace in four months.”
While the report was poor, the ADP report (below) and ISM jobs components bode well for employment figures over the coming months. As vaccine roll-out gets more traction it’s worth keeping in mind that approximately 45% of the private sector payrolls decline since February has been in the leisure & hospitality sector so the snap back could be a lot more intense than currently envisioned. Already, high frequency data is showing significant improvement (see spending chart above).


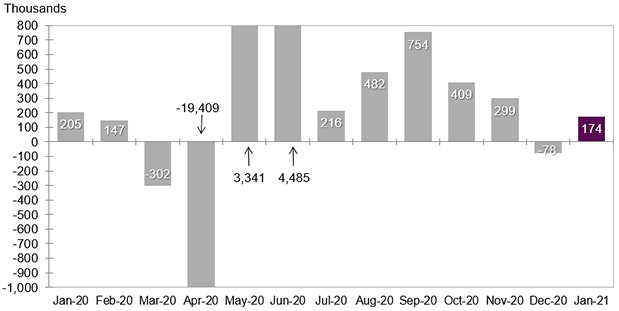
January US ADP employment +174k vs +50k expected. Previous month was revised higher by 40k jobs.
Composition: Small business +51k, Mid-size +84k and large +39k.
Goods +19k, Services +156k.
“The labor market continues its slow recovery amid COVID-19 headwinds. Although job losses were previously concentrated among small and midsized businesses, we are now seeing signs of the prolonged impact of the pandemic on large companies as well.”
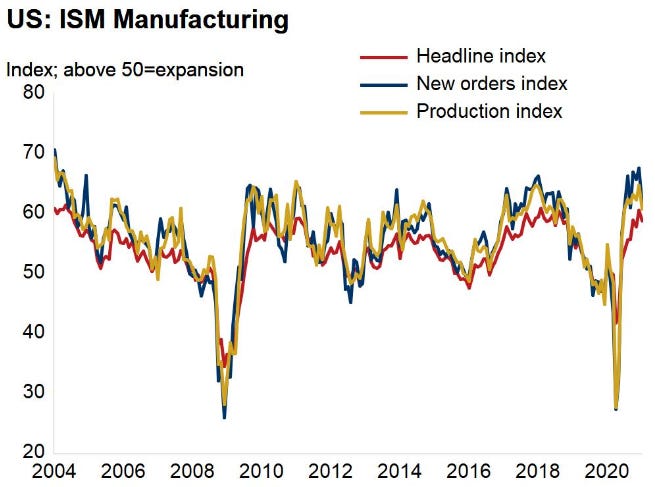
US ISM manufacturing for January 58.7 down from 60.5 in December. Of the 18 manufacturing industries, 16 reported growth in January.
New orders down to 61 from 67 drove much of the decline but still, this is a very strong print.
Employment up almost 1 point to 52.6, this is the highest level since the pandemic and the employment component only started to grow in November. US manufacturing employment still has 540k fewer people employed than February 2020.
Prices paid at 81.2, the highest reading since 2011 and it is the first time since 1978 that no firm reported lower prices.
Supplier delivery times at 68.2. Firms reported “labor shortages, strong demand and delays in supply chains.”
The US economy has been resilient despite COVID restrictions. Europe has had a more difficult time keeping the economy going. Composite and services PMIs for the Euro area were in contraction (sub-50) at 48 and 45, respectively.
German new manufacturing orders index fell 1.9%m/m in December. First fall in 7 months. Their retail sales fell 9.6% for December and it’s the steepest monthly decline since 1994. Both are further evidence that lockdowns across Europe are starting to have an impact on industrial activity and the broader economy.


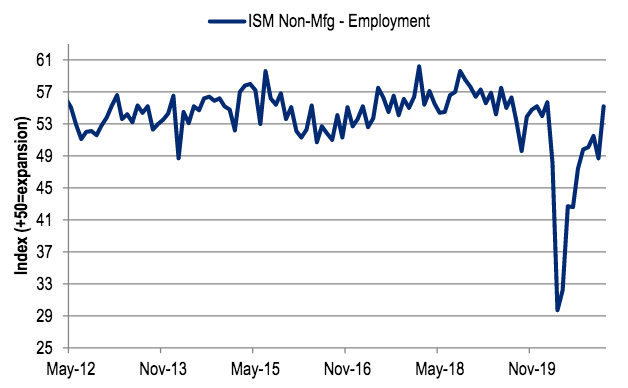
US Services PMI 58.3 in January ahead of expectations for 56 (Dec was 55).
2nd sharpest upturn in output in six years.
Strong increase in employment component to 55.2, the highest level since February 2020 reinforces strong trajectory of employment growth for services going forward. All of this was despite continued weakness in hospitality and leisure sectors that are still hampered by COVID restrictions.

US total construction spending +1.0% in December to $1.49trln, in line with street’s expectation.
Core construction spending, let by strength in single family housing, +1.1% for December in addition to upward revisions for prior months. It’s the 6th increase in the past 7th month. Total residential construction was up 21% y/y.
Since May, total construction spending has been rising an average of 1.2% per month and is now above pre-pandemic levels and the highest levels since 2002!
Bottom Line: There is still no end in sight to the housing market’s strength.
US light vehicles up to a 16.63mln annualized rate in January (estimate was 16.3mln) up from 16.2mln in December.
At the nadir, sales were 8.7mln rate in April and for context January 2020 sales were 16.9mln.

China's official manufacturing PMI prints 51.3 for January, the 11th consecutive month of expansion but down from 51.9 in December. The decline was a result of a slower expansion in large and medium-sized firms.
Official services PMI fell 4 points down to 51.1 as a result of a pickup in COVID cases and a resulting closure of hotel and entertainment sectors. Railway passenger traffic for the first 3 days of Spring Festival season was down 70% y/y.

Oxford Economics: “Businesses remain concerned over global economic prospects, despite some improvement in sentiment over the past month. Based on our latest survey of risk perceptions, almost half of respondents see activity in their business remaining below pre-pandemic levels throughout 2021.”

CENTRAL BANKS
Reserve Bank of Australia, in a surprise move, doubled its bond buying program and made clear that accommodative policy is here to stay, “Australia will need very significant monetary support for years.”
Will buy additional AUD100bln after the current 100bln program is done in April. Pace of purchases will remain at 5bln per week.
Benchmark rate and the target yield on the 3-year bonds (0.10%) left unchanged.
Governor Lowe pledged to maintain rates at the current levels until inflation has reached the 2-3% target “in a sustainable manner.”
Their current forecasts do not see this occurring until 2024 “at the earliest.”
“In terms of what other central banks are doing, many have recently announced extensions of their bond purchase programs. This is relevant to us, because we live in an interconnected world. If we were to cease bond purchases in April, it is likely that there would be unwelcome upward pressure on the exchange rate.”
US Federal Reserve Comments:
Minneapolis Fed’s Kashkari, very dovish, ““we are not even close to being at the right time to even think about adjusting the balance sheet size.”
“The key now is for the Fed to keep our foot on the monetary policy gas until we really have achieved maximum employment as we call it."
Cleveland Fed’s Mester, “It is now clear that the adverse effects of the pandemic have not been evenly distributed and there are wide disparities in the recovery across business sectors,geographic areas of the country, and demographic groups.”
St. Louis Fed’s Bullard, the vaccine combined with fiscal and monetary policy should lead to a “very strong” recovery and positive real GDP growth in 2021.
Rising inflation is still in line with the Fed’s new policy framework and as inflation approaches and exceeds the 2% target, it would be a welcoming “[...] development for the FOMC, as inflation has generally been below target for many years,”.
Bank of England Comments:
The Bank of England will give lenders six months to prepare for negative interest rates, anything sooner “would attract increased operation risks”. Banks will begin updating their IT systems to reflect the new policy. The PRA is set to ask banks for their readiness regarding negative rates in six months time, but reiterated that “such a request could be misconstrued as a signal that the MPC setting a negative Bank Rate was in prospect, or even imminent” further adding that “This was a signal that the Committee did not wish to send.”
Andrew Bailey, Governor, on negative rates:
“Particularly when you go negative, the transmission is much less clear because it does change the whole calculus of how the banking system works. We do not know with any confidence how that would work. However, there are experiences of other countries.”
Andy Haldance, Chief Economist, is cautiously optimistic on the economic recovery following the pandemic:
“If we get that recovery that I expect to start coming on stream, probably at the rate of knots from the second quarter, that will hopefully then eat away and improve the prospects of reemploying those million people who have lost their jobs.”
As members look to the future, “I feel much more confident about the second half of 2021 than I do about the first quarter of 2021, which is unusual but should be encouraging.”
Does the National Debt Matter? David Andolfatto, Senior Vice President at the Federal Reserve Bank of St. Louis doesn’t seem to believe it’s a dire situation.
The national debt grew to $20.5 trillion or 105% of GDP by the middle of 2020 from only $5.3 trillion or 35% of GDP in 2008. That is a 400% increase in just 12 years. David believes it is incorrect to view the national debt through the lens of a household, where unsustainable debt will bankrupt a household, a nation doesn’t face the same constraints.
On the topic of ‘Debt Issuance’, a household has a finite lifespan whereas a government can continually refinance its debt indefinitely. Government debt is much different than household debt because it mainly consists of marketable securities issues by the U.S. Treasury as bonds. In fact, from 1862-1971, the Treasury department issued some of its securities in the form of small-denomination bills which are indistinguishable from currency issued by the Federal Reserve today.
When interest comes due, the U.S. can print additional U.S. or Federal Reserve Notes (a legal tender), this technically means a default can only happen if the government permits it.
This makes the U.S. Treasury securities highly desirable for investors seeking a safe haven asset.
Domestically held debt creates domestic private sector wealth. Increasing the national debt makes individuals feel wealthier. Investors value the securities that define the national debt in the same way individuals value money - a safe store of wealth. David argues if the national debt is a form of money, wherein lies the concern?
If the interest rate on the national debt was on average less than the growth rate of the economy, the government can indefinitely run a budget deficit, using the debt to finance programs designed to enhance the productivity of the nation.
Presumably there is a limit to how much the market can handle Treasury securities for any given price level or inflation rate but right now, no one knows how high the debt-to-GDP ratio can get. David argues that we will only know once we get there.
Consistent debt issuance must be met with corresponding economic growth, otherwise inflation will corrode private wealth. As long as inflation stays in check, there should be little concern to the national debt. Since the 2008-09 recession, Personal Consumption Expenditures (PCE) inflation rate has averaged around 1.5%, this reinforces the idea that inflationary pressures have stayed in check as debt-to-GDP has grown exponentially.

To conclude, direct checks, PPP and credit market support is a necessary step to support individuals and businesses that have been affected by Covid-19 and the sharp increase in government debt may result in a one-time increase in price levels. A spike in inflation is not a signal to tighten monetary or fiscal policy as long as the spike is temporary. The higher price level that would accompany this event should be understood as the mechanism through which purchasing power is redistributed over the course of the pandemic.
FIXED INCOME, CURRENCIES, COMMODITIES
Last week we highlighted that, “Prices for commodities are surging. From aluminum (+39% since March) to scrap steel (up 60% since November) to corn (up 43% since Aug)... The cause of rising commodity prices are the COVID related supply chain disruptions that were not met with a subsequent fall in demand for many commodity intensive products.” The United Nations food agency highlights the negative aspect of this reflationary theme, food prices have now risen for 8 consecutive months and are at their highest levels since 2014.
The Food and Agriculture Organization (FAO) reported that their cereal price index rose 7.1%m/m in January, with maize rising 11.2%. Corn prices are now 42% above where they were a year ago. “China was importing unexpectedly large quantities of maize this season, which was having a significant knock-on impact on estimates for world utilization and stocks.”
Wheat prices +6.8%, “driven by strong global demand and expectations of reduced sales by Russia when its wheat export duty doubles in March 2021.”
Sugar +8.1%
The vegetable oil price index +5.8% and now at the highest level since 2012 as a result of falling production in Indonesia and Malaysia.
Dairy prices +1.6% and the meat index posted +1.0%.
“At this level, the world stocks-to-use ratio of cereals would decline from 29.7 percent in 2019/20 to 28.3 percent in 2020/21, marking a seven-year low.”
EQUITIES
“As of end of January, 47% of S&P 500 stocks had forward P/E greater than 20; slightly off recent peak in December but still higher than any level during dotcom era” Liz Ann Sonders, Charles Schwab.

As of the end of this week, 59% of S&P 500 have reported results for Q4’20
81% have reported earning above wall street forecasts and in total earnings havec come in 15% ahead of estimates, thus far.
79% of the companies that have reported have beat revenue estimates. In aggregate total revenue has come in 3.4% above the estimates,
Bespoke Investment Group highlighted a quirky dynamic that has been going on during earnings season, ““The S&P 500 is up over 2% since earnings season began in January, but stocks that have reported earnings this season have seen an average decline of 1.15% on their earnings reaction day. So even though the broad market is trending higher, the gains are not a result of big earnings moves. We also note an absolutely fascinating result from the current reporting: companies that beat EPS estimates have underperformed names that missed EPS on their earnings reaction days! As shown below, stocks that have beaten EPS estimates have fallen 1.22% on their earnings reaction days this season. Stocks that have missed EPS estimates have only fallen 0.81%. It’s not just that investors aren’t rewarding EPS beats, it’s that they’re practically punishing them!”
77 S&P500 components will be reporting earnings in the coming week.
Feedback
Thank you for subscribing to the Primary Dealer Review. If you have any questions or comments, please email me directly at primarydealer@weeklymacro.com and I will get back to you.
Do you know someone who would like to receive this publication? Please feel free to share the Weekly Macro Summary with them.
Legal Information and Disclosures
This weekly summary expresses the views of the author as of the date indicated and such views are subject to change without notice. The author has no duty or obligation to update the information contained herein. Further, the author makes no representation, and it should not be assumed that past investment performance is an indication of future results.
Moreover, wherever there is the potential for profit there is also the possibility of loss.
This weekly summary is being made available for educational purposes only and should not be used for any other purpose. The information contained herein does not constitute and should not be construed as an offering of advisory services or an offer to sell or solicitation to buy any securities or related financial instruments in any jurisdiction. Certain information contained herein concerning economic trends and performance is based on or derived from information provided by independent third-party sources.
The author believes that the sources from which such information has been obtained are reliable; however, it cannot guarantee the accuracy of such information and has not independently verified the accuracy or completeness of such information or the assumptions on which such information is based.
This weekly summary, including the information contained herein, may not be copied, reproduced, republished, or posted in whole or in part, in any form without the prior written consent of the author.