Weekly Macro Summary
8/16/2020
THIS IS NOT INVESTMENT ADVICE
Please speak with a registered investment advisor or other qualified financial professional before making any investment decisions.
Commentary
If you asked me to identify the single most important factor that caused people to underestimate the power of the economic rebound and the power of the stock market rebound that we’ve seen so far, I would point to the unprecedented amount of money that is being delivered into the hands of those with the largest propensity to spend it. The federal government quickly and aggressively made sure that a demand vacuum caused by lost wages did not take hold in the COVID economy. As you’ll read in this week’s summary, retail sales are now back to pre-COVID levels. Real time economic tracking data continues to point to a very sharp rebound in Q3.
Chart of the Week
US experiencing the largest and fastest, non-wartime, fiscal support in history
Source: BofA
If you would like to receive this macro summary directly to your mailbox every Sunday please subscribe. It’s free
Eco Data
Atlanta Fed GDPNow forecast is currently tracking at 26.2% for Q3, up from 20.5% last week.
NY Fed GDPNow Forecast is currently at 14.8%, up from 14.6% last week.
Core CPI inflation +0.62% m/m vs +0.2m/m expected. Y/Y core CPI was +1.6% (vs. +1.1% expected), strongest rise since 1991.
Strength focused on bounceback categories: airfare, used cars, new cars, hotels, apparel, motor vehicle insurance.
Airfares m/m (+5.4%)
Vehicle Insurance m/m (+9.3%)
Hotels / Lodging away from home m/m (+1.2%) - second consecutive month gain since lockdowns began
Apparel m/m (+1.1%)
Vehicle rentals m/m (+4%)
Prescription drugs Index m/m (-0.2%) - Interesting to watch as drug prices will be an important talking point as we get closer to the election.
While energy prices +2.5% m/m in July, prices are still 11% lower than a year ago.
Gas prices +5.2% m/m in July but still down -20% from last year
BLS: “data collection in July was affected by the temporary closing or limited operations of certain types of establishments. These factors resulted in an increase in the number of prices considered temporarily unavailable and imputed.”
Response rates for the commodities and services prices survey were 70% in July, down from 86% pre-pandemic, and unchanged from June.
With a 10.2% unemployment rate, don’t expect a sustained acceleration of inflation. The economy has too much excess capacity at the moment and jobless Americans will be receiving $200 less per week starting in August. This month’s data was largely a partial reversal of sharp decreases that resulted from a collapse in demand during the economic shutdown.
Source: Miller Samuel Inc. and Douglas Elliman Real Estate
US July retail sales increased +1.2% vs 2.1% expected. Sales were +1.9% excluding autos.
Retail sales have now fully rebounded to Pre-Covid levels!
9 of 13 sectors reported m/m gains
Nonstore retailers (reflecting e-commerce) sales have risen ~25% y/y and now represent ~20% of core retail sales.
The pandemic has accelerated the structural trend into e-commerce
Expiry of the federal unemployment benefit presents a 4% headwind to personal income in the coming weeks
Source: Macquarie
Source: Macquarie
Source: Macquarie
Source: Macquarie
Source: Chase
Initial jobless claims: 963K for first full week of August. This figure would still be an all time high, pre-pandemic.
Continuing claims: 15.5mln, down 9.4mln from the peak in May but, for perspective, that is twice as high as the highest print from the global financial crisis.
The bottom line: the employment market is mending quickly and this data series is an important one to follow. It provides high frequency insight into the health of the labor market. Rightly or wrongly, risk assets are discounting a continued quick recovery. Any stagnation in the normalization of these numbers at these levels would have disastrous consequences for the economy and for markets.
Job Openings & Labor Turnover (JOLTS) report showed 5.89mln openings, still down 16% from February but the June figure beat expectations handily (5.3mln).
In June, for every job open, there were three unemployed workers.
Total nonfarm quit rate was up to 1.9% in June and private sector reading is above 2% for the first time since March - demonstrates confidence from people who are leaving their jobs because they feel they can find another job somewhere else.
The NFIB’s Small Business Optimism down to 98.8 in July from 100 in June but in line with the data set’s historical average. Hiring intentions are picking up, a positive sign.
Source: Wells Fargo
CoreLogic residential mortgage delinquency data: "Early-stage and adverse delinquency rates increased for the second consecutive month – high correlation to geographies most impacted by COVID-19"
"All 50 states logged year-over-year increases in overall delinquencies this May."
"On a national level, 7.3% of mortgages were in some stage of delinquency (30 days or more past due, including those in foreclosure)."
Early-Stage Delinquencies (30 to 59 days past due): 3%, up from 1.7% in May 2019.
Adverse Delinquency (60 to 89 days past due): 2.8%, up from 0.6% in May 2019.
Serious Delinquency (90 days or more past due, including loans in foreclosure): 1.5%, up from 1.3% in May 2019. This is the first year-over-year increase in the serious delinquency rate since November 2010.
Transition Rate (the share of mortgages that transitioned from current to 30 days past due): 2.2%, up from 0.8% in May 2019.
"In January 2007 — just before the start of the financial crisis — the current- to 30-day transition rate was 1.2%, while it peaked in November 2008 at 2%."
CoreLogic forecasts the U.S. serious delinquency rate to quadruple by the end of 2021, pushing 3 million homeowners into serious delinquency unless there is significant government stimulus.
CoreLogic CEO, Frank Martell, “Government and industry relief programs have helped to cushion the initial financial blow of the pandemic for millions of U.S. homeowners...COVID-19 and the resulting pressures continue to influence the economic activity of many households. Barring additional intervention from the Federal and State governments, we are likely to see meaningful spikes in delinquencies over the short to medium term.”
A study of $650bln worth of commercial mortgages (across ~40,000 loans) that were originated between 2013 to 2019 found that, even before the virus-led economic slowdown, mortgaged properties’ net income potential were frequently overstated relative to the amount underwritten by lenders.
Actual net income was less than underwritten net income by greater than 5% in ~25% of the loans.
Commercial Mortgage Backed Securities (CMBS) market is a $1.4trln market within the fixed income arena.
The aggressive income projections and relaxed lending standards bodes poorly for the ability of borrowers to stay current and meet their obligations in this slowdown.
German survey of economic sentiment up to 71.5 from 59.3 previously. Crushes expectations of 58.
Additional virus breakouts and/or a second is not impacting business confidence.
US Industrial production +3.0% in July (+5.7% in June). Factory output +3.4%.
Remains 8% lower than levels a year ago.
Recall that last week only 26k manufacturing jobs were added to July’s payrolls. Production has retraced ~60% of its total decline but employment has only rebounded by ~45%. Expect further additions to employment in order to sustain these levels of production.
Central Banks
First Fed Funds rate hike not priced in until 2024.
New Zealand: RBNZ increased size of its asset purchases purchases from NZ$60bln to NZ$100bln.
Extended time frame for purchases from May 2021 to June 2022.
Signalled potential for negative rates next year.
“central bank purchases could absorb a larger proportion of the total market than previously thought without affecting market functioning...larger LSAP program would mean purchases could be front-loaded”.
Why does the RBNZ matter? Small, very open economy where many Central Banking ideas are first tested out to see if practical applications meet theorized benefits.
Mexico central bank cuts overnight rate to 4.5% from 5%.
10th consecutive cut in their overnight that now brings it to a 4 year low.
Mexican Peso (MXN) is a favorite way for market participants to gain exposure to emerging markets because of its liquidity. The spot currency has appreciated against the USD 13% since March 23 but is still down 16% ytd.
Source: Bloomberg
Fixed Income, Currencies, Commodities
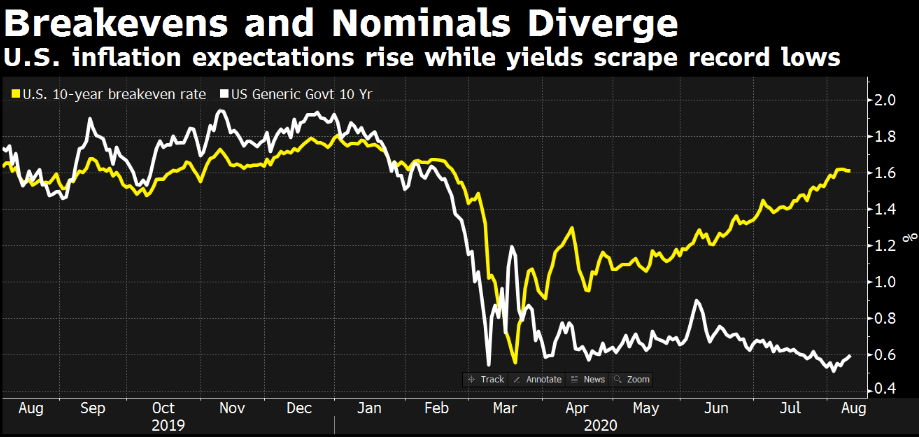
The best leading indicator of the economic recovery has been the stock market. Stocks foreshadowed the current progress that’s been made for the economy’s path back to normal. With strong equity markets and a significant amount of US Treasury supply, one can’t help but wonder about the sustainability of the disconnect between a stock market rapidly approaching all time highs while the bond market offers a 10 year Treasury yield of 0.70%. Is there a reconciliation imminent? If so, will it be via a lower stock market or a lower bond market (higher yields)?
US Weighted Average Maturity of Marketable Government Debt Outstanding.
Source: BofA
Source: Bloomberg
Ball Corp, beverage-can manufacturer, whose credit rating is below investment grade, sold $1bln of 10yr bonds with a coupon of 2.875%.
Lowest rate on record for a sub-investment grade bond maturing in more than 5 years.
Interestingly the spread to treasury rates is similar to pre-COVID but corporations only care about the nominal rate because that represents their interest expense
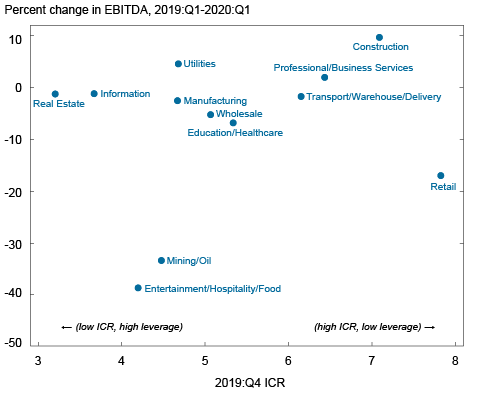
NY Fed: Implications of the COVID-19 Disruption for Corporate Leverage
Pandemic had a negative impact on cash flow but also reduced corporations’ interest expenses. The cash flow shock far outpaced the benefit of lower interest payments
A sizable share of U.S. corporations have interest expense greater than cash flow. This raises concerns about the companies' ability to survive a further shock or downturn in the economy.
The most impacted industry: Mining/Oil. The second most impacted industry has been Entertainment/Hospitality/Food
Almost 37% of publicly firms in Entertainment/Hospitality/Food industry had interest coverage ratios below 1.
Source: New York Fed
Fitch Ratings reports that the trailing-twelve-month (TTM) high-yield default rate in the US rose to 5.1% at the end of June.
Q2 default volume: $41.1bln. Previous record was $39.5bln in 2009.
Epiq: 3,604 companies filed for Chapter 11 through June.
Edward Altman: 30 US companies with liabilities greater than $1bln have filed for Chapter 11 this year
Fed's weekly data of “allowance for loan & lease losses” was $115bln at the end of February and rose to $185bln as of 7/29.
Corporate bond markets have picked out winners and losers. High yield markets, generically, have seen spreads tighten 500 basis points. It's amazing to note that, during the corporate bond markets improvement, the Fed has only purchased $12bln for its corporate bond facility that has a capacity of $750bln
Fed's senior loan officer survey, “Major net shares of banks that reported reasons for tightening lending standards or terms cited a less favorable or more uncertain economic outlook, worsening of industry-specific problems, and reduced tolerance for risk as important reasons for doing so”
16 U.S. energy firms filed for bankruptcy protection in July bringing the total to over 50 since March.
Notional value of these companies’ debt is nearly $50bln.
“This latest downturn not only affects smaller recently hatched shale producers, but July saw two of the largest filings involve well-established oil companies”
2020 is on pace for $350bln total high yield issuance for the year. That would be 10% more than the all time record set in 2012 ($320bln).
Source: BAML
Gold fell ~6% on Tuesday, its worst one-day drop since 2013.
Gold is still up 28% ytd and this type of dramatic sell-off is not unusual in large rallies like the one Gold has experienced since the end of March.
Recall that last week we highlighted that the two driving factors of the gold price are 1) Uncertainty and 2) Negative real yields which lower the opportunity cost of holding a zero-coupon asset such as gold. Those two drivers of the narrative have not eased.
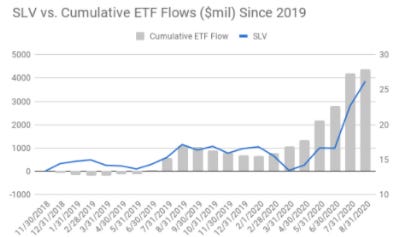
Silver fell 13% on that day but is still up 47% this year. ETF flows into silver have surpassed $3bln ytd. While there’s nothing on the horizon to suggest a change in momentum, a change in real yields or an easing of uncertainty is likely to presage a reversal.
Source: WingCapital Investments
Source: Goldman Sachs
Source: Goldman Sachs
Oil prices reached their highest settlement price since early March. This week saw the third consecutive weekly decline in domestic crude inventory.
Total products supplied over the last four-week period averaged 18.5 million barrels a day, down by 14.3% from the same period last year.
Motor gasoline product supplied down by 10.2%
Distillate fuel product supplied down by 9.3%
Jet fuel product supplied down by 45.8%
Source: U.S. Energy Information Administration
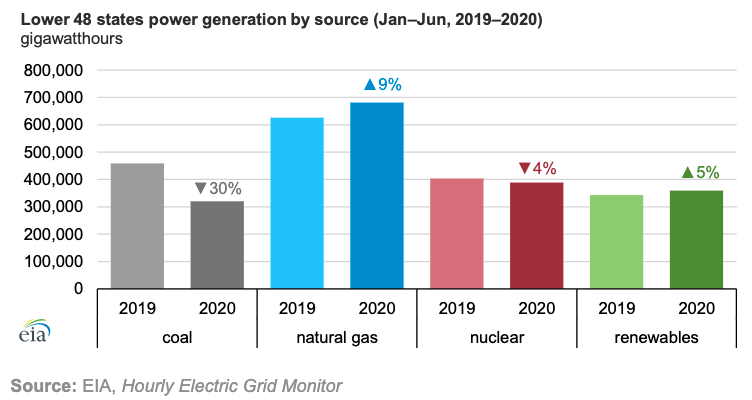
Natural gas-fired generation in the lower 48 states increased nearly 9% in the first half of 2020, compared with the first half of 2019, marking it as the fastest-growing source of electric power generation.
Renewable realized a 5% increase over the same period. The transition away from coal power generation in the United States continues.
Equities
The S&P 500 is back near its previous all time high. The recent performance has been attributed to the following: bending of the COVID-19 infection curve, optimism about a vaccine in the fall as well as an executive order that extended enhanced unemployment benefits for jobless Americans. Despite the market’s rally, as you’ll read below, some sentiment measures are still not heading higher.
Citi’s Panic/Euphoria model for equities remains in euphoria territory and at levels not seen since 2001.
According to Citi, the model estimates a 95% probability of down markets in the next 12 months.
Bespoke Investment Group: “Thursday marked 100 trading days since the S&P 500 made its COVID Crash closing low on March 23rd. Over this 100-trading day span, the S&P rallied 51.3%”
Fewer than ten instances in which the S&P 500 has even gained more than 35% over a 100-trading day span.
“Prior extreme moves mostly saw a continuation of gains in the coming months.”
S&P 500 is less than 0.5% from its all time high but the AAII bullish sentiment index is at 30% which is 10 percentage points lower than what would be expected this close to all time highs.
To repeat what we said here last week, “If the old Wall Street adage is true that, ‘the market climbs a wall of worry’, then stock markets globally still may have more room to push higher.”
Simon Property Group, the largest mall owner in the US, in talks to have Amazon take over empty space left by department stores.
Would turn anchor department store spaces into Amazon distribution hubs.
Focused on converting stores formerly or currently occupied by J.C. Penney Co. Inc. and Sears Holdings Corp.
At least 25 major retailers have filed for bankruptcy in 2020. After filing, the retailers then ask to reject their leases. This is having negative consequences on commercial property landlords who, in turn, have missed payments on some of their outstanding debt.
Coresight research expects as many as 25,000 stores to close this year and Green Street Advisors estimates that up to half of all mall department stores could shut for good by the end of 2021.
Royal Caribbean Group, the cruise company, announced Wednesday that it had secured a $700mln credit facility.
The loan’s interest rate will be Libor + 3.75pct.
With U.S. ports remaining under a no-sail order through September 30th, this credit line will help bolster future liquidity needs.
Demonstrates a willingness for the bond market to take risk and envision a recovery for temporarily impacted businesses.
Royal Caribbean is also an asset rich business so bond holders are betting that should the company default in the coming year, there is enough collateral to protect the loan’s principal.
Significant excitement surrounding Apple as it prepares a series of service bundles. These bundles will let customers subscribe packages of Apple’s digital services at a lower monthly price. Dubbed “Apple One”, and expected to launch in October with the next iPhone release.
Apple attempting to capture even greater customer loyalty similar to what has been by Amazon with “Amazon Prime”.
In the past year Apple has added 125mln paid subscriptions across the services on its platform which now has 515mln subscribers.
Source: Statista
Mergers & Acquisitions activity heating up: 8 deals worth over $10bln signed in the past 6 weeks.
Refintiv says it’s the fastest start for second half deals of $10bln+ since 2007.
June and July each saw more than $300bln in M&A activity.
In Q2, Apple, Microsoft, Google, Oracle and Facebook repurchased $35bln (up 10% y/y)
The rest of S&P 500 companies COMBINED repurchased $50bln (down 62% y/y)
Source: StoneX
Source: Yardeni.com
Last week we asked, “Where to look for market expectations of election outcomes? Look at Banks, Drugs and Defense stocks.”
Price action indicates a growing market belief that control of the White House and Senate is going to be taken by Democrats.
Health stocks continue to indicate that Dems are likely to win both chambers of Congress
Source: Cornerstone Macro
Geopolitics
Last week we highlighted a new Hong Kong security law that permits for protesters to be arrested.
The law was imposed by Beijing without the approval of Hong Kong’s legislature.
On Aug. 10, Hong Kong's newly established National Security Department unit carried out a series of arrests of 10 individuals for violating that new national security law.
The highest profile arrest is Jimmy Lai, a media industry billionaire. He was arrested along with his two sons and several executives at his newspaper.
Australia, Britain and Canada, among others, recently cancelled their extradition treaties with Hong Kong.
A cargo carrier owned by Nagashiki Shipping ran aground and spilled 1,000 tons of fuel off the coast of Mauritius causing the country’s worst ecological disaster.
Government was already under increasing pressure to reopen the airport and rescue the tourist industry due to COVID-19 shutdowns. The industry generated $1.6bln last year and employs about a fifth of the country’s workforce.
Oil pollution is expected to move north along the coast and could affect the regions of Grand Port, Bambous Virieux and Flacq, according to the OCHA.
Mauritius lies on the shortest straight-line route between the Strait of Malacca, which links the ports of Asia to the Indian Ocean, and the southern tip of Africa. That makes it the route of choice for shipping between the east and west. Implementation of new regulations may affect these shipping routes.
Roughly 1.116 million barrels of Iranian fuel bound for Venezuela was seized by the US on Wednesday.
Although Venezuela controls one of the world's largest crude reserves, its production of refined gasoline falls short of its domestic needs.
Amid stiff U.S. sanctions, commercial traders have shunned Venezuela, prompting it to turn to Iran, which is also the subject of sanctions from Washington.
Seizure took place "with the assistance of foreign partners." These partners remain unnamed.
On July 21, a virtual meeting summoned by president Cyril Ramaphosa of South Africa, the current chair of the African Union, deliberated the fate of the negotiations between Egypt, Ethiopia and Sudan over the Grand Ethiopian Renaissance Dam.
Concluded by extending the AU-led technical negotiations after the US-led negotiations faltered in mid-February 2020.
The last 10 years have also seen significant economic and political changes in the Blue Nile basin. These have included the birth of a new state (South Sudan), the Arab Spring in Egypt, and impressive economic growth in Ethiopia with large-scale foreign investments in agriculture.
The gravity dam sits on the Blue Nile and began construction in 2011.
Tensions escalated when Ethiopia announced it had begun filling the reservoir, contrary to their downstream neighbors’ mandates.
Punditry
Ed Yardeni asks, “In a world of zero interest rates, what is the fair value of the S&P 500 forward P/E?”
At 22x forward earnings, are stocks too expensive?
The average of the S&P 500’s P/E since 1960 has been ~15x
The P/E has generally been below the historical average when inflation and interest rates are rising and high.
The P/E has generally been above the average when inflation and interest rates are falling and low.
Eventually the P/E will revert to the mean, that can happen with movements in the numerator or denominator or both. With a zero interest rate world for the foreseeable future, maybe the new normal P/E should be 30 instead of the historical 15.
S&P 500 dividend yield has been around 2% since 2009.
10yr treasury yield has exceeded the dividend yield consistently from 1958 through 2008.
10 year yield currently yields approximately 0.60% versus a Q2 dividend yield for the stock market of 1.92%.
Some projections estimate the dividend yield to get to around 1% by year's end before rebounding starting in 2021.
From the late 70s through the late 90s, there was a good correlation between the 10-year US Treasury bond yield and the forward earnings yield. This correlation broke down after the late 90s but by this measure, and when looking at dividend yields, stocks are looking increasingly cheap relative to bonds. So perhaps in the current environment, stocks should trade at a higher P/E than their historical average, the art is in determining “how much higher?”
Mohamed El-Erian, Chief Economic Advisor at Allianz: 2 perspective on dollar's recent weakness: 1. How it benefits the US economy and 2. It demonstrates dollar’s fragility and potential loss of reserve currency status .
From a textbook perspective a weaker USD is beneficial because it, "boosts US producers’ international and domestic competitiveness relative to foreign competitors, makes the country more attractive for foreign investors and tourism (in price terms), and increases the dollar value of revenue earned overseas by home-based companies. That is also all good for US stock and corporate bond markets, which benefit further from the greater attractiveness of dollar-denominated securities when priced in a foreign currency."
Others argue that the weakness is unwelcome because it's an additional factor to convince reserve managers to diversify away from dollars. The other recent factors have been US protectionist policies toward trade and the use of the dollar's reserve status to impose sanctions.
El-Erian concludes that both narratives are overstated. The dollar is weakening from strong levels (see commentary last week for more details) and there isn't another currency in the world that can fill in for the dollar's role.
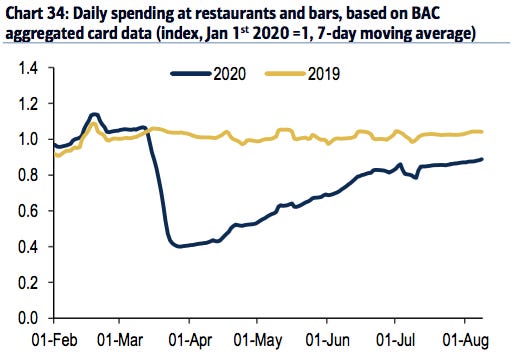
“COVID-19 and the consumer: data through August 8th and the month of July”
Charts from Bank of America


Feedback
Thank you for subscribing to the Primary Dealer Review. If you have any feedback on the content or format, or have any questions, please email me directly at primarydealerreview@gmail.com and I will get back to you.
If you’d like to support the Primary Dealer Review, please feel free to share the publication with your friends and colleagues.
Legal Information and Disclosures
This weekly summary expresses the views of the author as of the date indicated and such views are subject to change without notice. The author has no duty or obligation to update the information contained herein. Further, the author makes no representation, and it should not be assumed, that past investment performance is an indication of future results.
Moreover, wherever there is the potential for profit there is also the possibility of loss.
This weekly summary is being made available for educational purposes only and should not be used for any other purpose. The information contained herein does not constitute and should not be construed as an offering of advisory services or an offer to sell or solicitation to buy any securities or related financial instruments in any jurisdiction. Certain information contained herein concerning economic trends and performance is based on or derived from information provided by independent third-party sources.
The author believes that the sources from which such information has been obtained are reliable; however, it cannot guarantee the accuracy of such information and has not independently verified the accuracy or completeness of such information or the assumptions on which such information is based.
This weekly summary, including the information contained herein, may not be copied, reproduced, republished, or posted in whole or in part, in any form without the prior written consent of the author.


