
Weekly Macro Summary
8/9/2020
THIS IS NOT INVESTMENT ADVICE.
Please speak with a registered investment advisor or other qualified financial professional before making any investment decisions.
Commentary
While global economic activity remains weak relative to pre-virus levels, data and high frequency indicators continue to rebound strongly. Levels of risk assets suggest a sustained recovery while sentiment measures and barometers of implied volatility suggest investors are suspicious of the recent performance in asset markets. This divergence between strong market performance and negative investor sentiment is unusual. Typically, sentiment tracks the recent performance in markets. If the old Wall Street adage is true that, “the market climbs a wall of worry”, then stock markets globally still may have more room to push higher.
Chart of The Week

*Total market value of the top 5 stocks in the S&P 500 has increased 266% since 2015, while the remaining 495 stocks in the index have only increased 25% over the same period.
The Chart of the Week shows how much the expansion of the S&P500, since 2015, has been driven by the 5 biggest companies in the index
If you would like to receive this macro summary directly to your mailbox every Sunday please subscribe. It’s free
Eco Data
Summary: Global economic data continues to surprise on the upside in August as re-openings and activity pickup while global coronavirus cases ease. Key risks remain in that US fiscal stimulus discussions are at an impasse and US-China tensions continue to escalate.
Atlanta Fed GDPNow forecast is currently tracking at 20.5% for Q3, up from 11.9% last week.
NYFed GDPNow Forecast is currently at 14.6%, down from 16.9% last week.
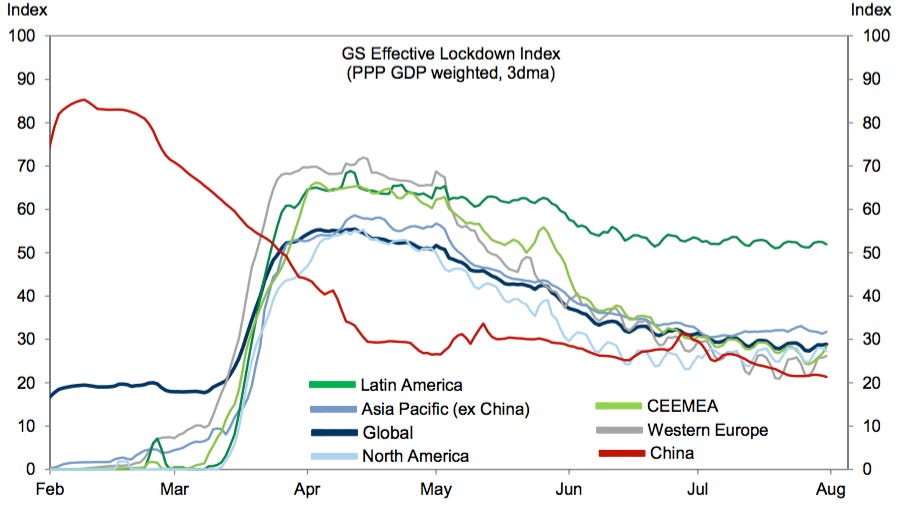
Source: Goldman Sachs

Source: Goldman Sachs
US Non Farm Payrolls: +1.763mln jobs created in July (1.48mln expected). The US Unemployment rate fell down to 10.2% from 11.1% previously and ahead of the consensus estimate for a 10.6% rate.
Third consecutive month of job growth
Average hourly earnings +0.2%
Private payrolls +1.462mln
Service-sector rebounding: 502K in restaurants, 258K in retail, and 191K health care.
Slow construction and manufacturing growth, 20k and 26k respectively
Percent of job losers reporting a temporary layoff is now at 71%, down from 74%.
Overall a solid number that is in line with, and confirms, the rebound being shown by high frequency data and other recent economic releases.
Worldwide manufacturing output rose in July at the fastest pace since Dec 2018 as increasing numbers of companies stepped up production after COVID-19 closures. The rate of growth nevertheless remains modest - equivalent to output growing just 2% per year.
Rising factory production was reported in July across 20 of the 31 countries for which IHS Markit collects manufacturing PMI data, the highest proportion since December 2018 and up from just one (China) in both April and May.
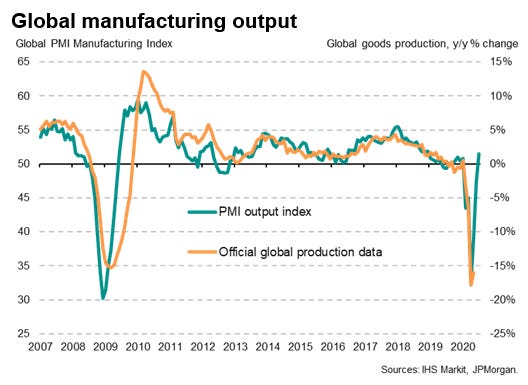
Source: IHS Markit
U.S. Markit manufacturing PMI rose 1.1 points to 50.9 in July versus 49.8 in June.
Expansionary territory and best since January.
Output index up to 51.7 from June 47.5.
Factory Orders (mom%) declined 1.5 points to 6.2 in June versus 7.7 in May
U.S. ISM manufacturing index rose 1.6 points to 54.2 in July after 52.6 in June
New orders to 61.5 after 56.4 in June. Highest since September 2018.
The employment component up to 44.3 but has been below 50 (indicating contraction) since August 2019. Still shows more firms reducing than increasing employment
Respondents saying inventories too low: 29.4% vs too high: 12.6%

Source: Renaissance Macro
U.S. factory orders climbed 6.2% in June following the 7.7% bounce in May from the record -13.5% dive in April.
Durable goods orders were bumped up to 7.6% from 7.3% in the advance report.
Transportation orders rose 20.2% after May's 78.8% jump.
Shipments +9.8% versus the 3.0% increase in May. Nondefense capital goods shipments excluding aircraft were up 3.3% from 1.5% in May.
Inventories rose 0.6% after the 0.2% May gain. The inventory-shipment ratio dropped to 1.51 from 1.65.

NFIB Small Business Optimism Index - Sentiment is rebounding
NFIB: Percent Planning to Increase Employment
Eurozone composite PMI rises up to 54.9 for July vs 48.5 in June. Eurozone economy is back in expansion.
July PMI data pointed to the sharpest rise in Eurozone private sector business activity for over two years. The result marked the first expansion since February, with both manufacturers and services firms registering marked increases in output. Source: IHS

Source: IHS
Eurozone retail sales +5.7% m/m in June. May revised to +20.3% m/m from 17.8%
Couldn’t believe this chart when I saw it but Eurozone retail sales are actually up year over year and are now at an all time high on a nominal basis.
Eurozone Retail Sales Volume

Source: Eurostat
German factory orders +27.9% m/m in June vs 10.1% expected.
Orders down 11.3% y/y and still ~9% below pre-Covid levels. Indicates likelihood of a fast re-acceleration in industrial activity in Q3.
US Total rail carloads +2.2% week/week as of 8/1, was +1.4% the prior week. Total carloads +29% from May’s low, still down ~9% y/y.

Source: Chase
US new auto sales registered +11% m/m for July. -12% y/y. Year to date, sales are down 22% versus 2019 levels.
All things considered, the overall fall in auto sales has been moderate when you consider the scope of economic shut down and lack of overall activity
Inventories are tight relative to demand, manufacturers seem to have been caught off guard by the current level of demand
Also worth noting, used vehicle prices are rising significantly. Why? Individuals have avoided public transport and ride sharing and have been purchasing used cars as their primary means of transportation the last several months

Source: Manheim
Central Banks
G10 economies have 0 rate hikes priced in across all 10 economies for at least the next 24 months.
Fed current philosophy: “We’re not thinking about raising rates. We’re not even thinking about thinking about raising rates.” -Fed Chairman Powell
“We have held our policy interest rate near zero since mid-March and have stated that we will keep it there until we are confident that the economy has weathered recent events and is on track to achieve our maximum employment and price stability goals.”
Chicago Fed President Charles Evans: “The ball is in Congress’ court...Fiscal policy is fundamental to a better baseline outlook, to a stronger recovery and getting the unemployment rate down, people back to work safely, and ultimately reopening the schools safely.”
Richmond Fed President Thomas Barkin, “quickly pulling away the support that consumers and businesses are receiving would be a pretty traumatic move for what’s happening in the economy.”
WSJ's Nick Timiraos wrote a widely referenced piece this past week entitled, "Fed Weighs Abandoning Pre-Emptive Rate Moves to Curb Inflation"
"The Federal Reserve is preparing to effectively abandon its strategy of pre-emptively lifting interest rates to head off higher inflation, a practice it has followed for more than three decades."
"Fed officials would take a more relaxed view by allowing for periods in which inflation would run slightly above the central bank’s 2% target, to make up for past episodes in which inflation ran below the target."
Jan Hatzius, Goldman Sachs Chief Economist, “It would be a significant change in terms of how they are thinking about...A lot of those things look very different now from the way they looked a few years ago"
Fed will soon conclude a comprehensive review, that began last year, of its policy-making strategy
Essentially telling markets that rates will stay low for a very long time.
"One way for the Fed to do that would be to amend that document to say inflation should average 2% “over time.”"
Fed implemented a formal 2% inflation goal in 2012.
The current 2% inflation target is symmetric
"In June, Lael Brainard cited research that would have the Fed refrain from raising rates until inflation reached 2%, rather than initiating rate increases before achieving the target and on the basis of a forecast of higher inflation, as the Fed did in 2015."
Philadelphia Fed President Patrick Harker recently suggested a preference to hold rates at low levels, “until we see substantial movement in inflation to our 2% target...“ideally overshooting a bit.”
Vice Chairman of the Fed, Richard Clarida, on CNBC: while the economic picture remains complex his baseline outlook for the US economy is unchanged for the economy to return to pre-pandemic activity levels around Q4 of 2021.
It’s interesting that in their June summary of economic projections, the Fed was almost unanimous in projecting 0% fed funds rate through 2022 despite this baseline view that Clarida articulated.
Bank of England on Thursday had no policy change but a small yet important change to guidance.
Unanimously voted to keep rate at 0.1% and asset purchase target at £745bn
Will not tighten policy until, "significant progress is being made eliminating spare capacity and achieving the 2% inflation target sustainably”
The important change is that language that said the lower policy rate bound of “slightly above zero” was removed implying that there is the potential for the BOE to implement negative rates.
At press conference, they said negative rates are not really a favorable risk/reward for now
Fixed Income, Currencies, Commodities
USD Positioning, as measured by the DXY is at extreme bearish sentiment
Dollar spot index (DXY) down ~4% over the past month and down almost 10% since March.
This does not capture the real picture of what's happening with the dollar as the DXY has as it's top 4 weights: 58% EUR, 14% JPY, 12% GBP, 9% CAD.
Fed’s trade-weighted broad dollar index is a better barometer of the dollar's performance globally and with regard to impact on the US economy as it will more accurately reflect the dollars’ impact on imports and exports.
Important to keep in mind that dollar weakness typically correlates with strength in global asset markets and significant dollar strength usually occurs in periods of market instability and uncertainty as capital repatriates back to the US as a safe haven. It may be counterintuitive but a steadily weakening dollar is usually a good sign for investor risk appetite.

Federal Reserve Trade-Weighted USD Indices

Source: Capital Economics

Source: Cornerstone Macro
In a new research note, Citigroup asks: “What is Gold Telling Us?”
Is Gold Predicting a Burst of Inflation?
“Central Bank balance sheets and rising credit growth to the private sector seem to support the gold hedge against price inflation.”
“The monetary theory of inflation has been replaced by labor and product market micro theories, and market pricing of inflation risk is low”
“Gold is not presaging inflation.”
Is Gold Presaging a Loss of the Dollar’s Exorbitant Privilege?
“Some suggest that the gold rise traces the trend depreciation of the dollar, presaging its decline as the premier international reserve asset.”
“No other currency or country is ready or willing to take on the dollar’s role.”
“The Fed’s massive provision of dollars via swap lines only emphasizes the premier role.”
“Exorbitant privilege remains.”
Is Gold a Measure of Uncertainty and Potential Equity Rout?
“Uncertainties are rising — health, economic, political — yet so too are equity markets, even as real economies swoon.”
“The negative correlation between equity and gold in the past is reflected in increased gold hedges operationalized via ETFs.”
“Gold is a metric both of uncertainty and the value of a hedge.”
Is Gold Rising on the Fundamentals?
“Gold prices are being driven by Central Bank actions that yield negative real yields.”
Negative real yields lower the opportunity cost of holding a zero-coupon asset such as gold.
“The ongoing gold bull rally is the result of a confluence of all the above factors and a few more, along with a dash of momentum in precious metals.”
Cumulative flows into precious metals ETFs
The US 10 year real yield has fallen significantly since June from -40bp to -110bp
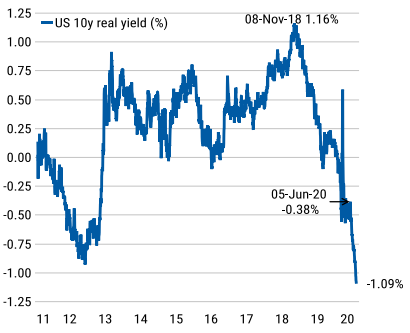
Source: Morgan Stanley
Equities
Through Friday, 89% of the companies in the S&P 500 reported financial results for Q2, 2020
Earnings are down 33.8% for Q2, on a y/y basis and revenue is down 9.8% y/y for the quarter
Despite the abysmal results, 83% of companies have reported earnings that beat estimates, if this holds it will be the highest level recorded according to FactSet’s records which go back to 2008
In aggregate, earnings have come in 22% ahead of estimates, also a record for the data series.
64% of companies have beaten sales estimates for an aggregate total of 1.5% beat
Current forward 12-month P/E ratio is 22.3
Via Bespoke Investment Group: In Q2 Corporate Chapter 11 Bankruptcies reached their highest level since 2017. From March-June was one of the biggest corporate bond issuances in history. At its peak the 4 week moving average of corporate debt issued was ~$465bln.
“The result is a massive store of cash on corporate balance sheets in aggregate, even as profits plunged. In the second chart at left, we show corporate debt liabilities relative to total assets and liquid assets (currency, deposits, money market funds, and US Treasury securities) relative to total assets.”
Corporations have more cash on their balance sheets than at any point in the past 50 years.
Over 5% of assets are in cash.
While these cash balances have been funded by debt issuance only ~23% of corporate assets are funded by borrowing putting it within the norm of historical levels.
“The key takeaway here is that as the crisis hit, aggregate corporate balance sheets were in good shape. That in turn is an indication that while specific industries face massive risk, the aggregate macro backdrop for credit is much friendlier than it might seem.”

Source: Bespoke Investment Group
US Junk Bond Yields are Back Below 6%
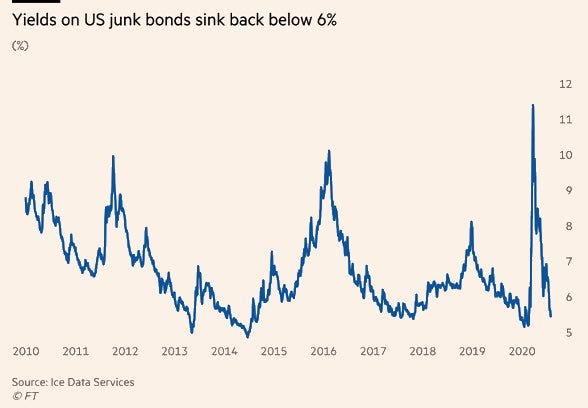
Source: FT

Source: Morgan Stanley
Combine the FANG stocks with Apple Inc. and Microsoft Corp., and the result is a market-value powerhouse from a global perspective. The combined value of the “FANMAGs” reached $7tln for the first time Monday, according to data compiled by Bloomberg.
They exceeded the total value of shares in six developed-market stock indexes: Canada’s S&P/TSX Composite, France’s CAC 40, Germany’s DAX, Italy’s FTSE MIB, Spain’s IBEX 35, and the U.K.’s FTSE 100.

Where to look at market expectations of election outcomes? Look at Banks, Drugs and Defense stocks. Price action seems to indicate a growing market belief that control of the White House and Senate is going to be taken by Democrats.
Zillow Group Inc. reported second-quarter revenue well above expectations:
2Q20 revenue at $768mln, street was estimating $619mln
Home segment revenue up 82% from 2Q19 report
Average Monthly Unique Users up 14%
Number of Homes Sold at 1,437, up 83% from 2Q19
CEO stated the COVID-19 pandemic and WFH policies “are inspiring people to rethink their homes and consider moving”
The strength of the home sales and home construction market is arguably the least appreciated sector in the US economy right now. Its strength is a good sign for how the economy may continue to recover in a strong manner over the coming year.
Fastly Inc - Cloud Computing
Revenue at $74.7mln, up 19% from Q1 revenue
Revenue increase supplemented by increase internet usage and social distancing measures put in place as stated by management
Etsy Inc.
Revenue at $428mln up 137% YoY
Net Income at $96mln up 429% YoY
Realized an increase of 18.7mln new buyers and reactivated buyers
Active Sellers and Buyers up 35% and 41% YoY Growth, respectively
Revenue increase supplemented by shifts in consumer shopping habits and are expected to have extended through July as stated by management
Mask sales totaled $346mln, ranking the product 3rd on the platform as its own category
Wayfair Inc. - Online Home Furnishings
Reported net revenue at $4.3bln, up 83.7% YoY
Adjusted earnings per share of $3.13 from a per-share loss of $1.35, well above consensus
Gross profit $1.3bln or 30.7% of total net revenue
Wayfair realized an increase of 104.9% in orders delivered during Q2 YoY
Stock is up 232.5% YTD through Friday
When people started to work from home, they clearly decided it was an important time to start better furnishing their new work spaces!
Under the Radar: Share repurchase programs in the United States are slowing. This has been a significant driver of EPS growth for US equities. Net-repurchases has been shown to be the biggest factor in determining the relative performance of countries’ equity markets.

Source: BofA
Geopolitics
Summary
HHS Secretary Azar was scheduled to visit Taiwan.
Highest level visit since switching diplomatic recognition to China in 1979, a move Beijing has condemned
White House is strong arming TikTok to sell itself.
Faces a 9/15 deadline to either sell its US operations to Microsoft or become banned from the US.
Microsoft said it’s working to purchase the entirety of TikTok’s operations globally a price tag rumored to be as high as $30bln.
Earlier this week Apple is said to have entered the race to buy the company.
China’s ministry of foreign affairs, ““If everyone were to follow the US’s practice then anyone can invoke national security to take similar measures against a US company. The US should not open this Pandora’s box otherwise it will swallow the bitter fruit.”
White House on Wednesday said it was going to try to purge “untrusted” Chinese apps from US
Called WeChat and TikTok, “significant threats”
Secretary of State Pompeo, “With parent companies based in China, apps like TikTok, WeChat and others are significant threats to personal data of American citizens, not to mention tools for CCP (Chinese Communist Party) content censorship”
UK and China Strained Relations:
At odds in recent months over the pandemic, technology, and Hong Kong.
Recall that the UK returned Hong Kong to China with the promise of, “1 country, 2 systems”. China has recently reneged on this ideology.
A few years ago it seemed like the UK was forging strong relations with China when they permitted significant investment into the UK economy. More recently however, The British government banned Huawei from providing components to the UK’s 5G network infrastructure.
The final straw in the recent escalation of conflict was when Beijing imposed a security law that permits for Hong Kong protestors to be arrested. In response, the UK has offered a path to citizenship for many of the region’s citizens.
The most important company, for the pandemic, that you’ve never heard of: BGI Group, a Chinese genomics research company has sold 35mln rapid COVID-19 tests in the past 6 months. Company operates in two aspects with regard to COVID: diagnostic tests and gene sequencing equipment. Their COVID-19 lab equipment is used in at least 10 countries. The equipment was donated by the company's charitable arm.
BGI is calling on international health researchers to send in virus data generated on its equipment, as well as patient samples that have tested positive for COVID-19, to be shared publicly via China’s government-funded National GeneBank.
US concern is that China would use this global genetic data for non-health purposes. BGI operates China’s national genetic database. Sharing data is an essential part of medical research but skeptics worry that China may weaponize the information they gather. BGI and Huawei have said they work together.
In a video that used to be on Huawei's site a BGI executive said it processes “staggering volumes of data” from its gene sequencers, that it stores on Huawei systems. BGI has been accused of intellectual property violations from Illumina, a US-based maker of gene sequencing equipment.
Two BGI subsidiaries are alleged to have engaged in human rights violations for being involved in conducting genetic analysis of Uighur Muslims in Xinjiang.
This news reinforces the current tailwinds for companies to restructure their pharmaceutical supply chains away from China.

Source: WSJ
Punditry
Raghuram Rajan, prominent economist and former head of the Reserve Bank of India
Advanced economies have already spent enormous amounts providing pandemic relief to households and small- and medium-size businesses.
IMF June outlook estimates that, including fiscal measures and credit guarantees, spending reached approximately 20 percentage points of GDP in advanced economies.
More government spending, and thus borrowing, will be needed by the time the pandemic is behind us.
Some argue that because of current low interest rates, sovereign debt remains sustainable at much higher levels than in the past.
This sustainability is contingent on 3 factors: 1. Nominal GDP growth resturns to a reasonable level. 2. Interesting rates stay low. 3. Future governments limit their spending
Massive debts accumulated during the current crisis will not be repaid soon and a large share will be passed onto future generations.
Today, societal aging, low public investment, and tepid productivity growth are all headwinds toward higher relative prosperity for future generations.
"Government spending is necessary today. But just because sovereign-debt markets have not yet reacted adversely to extremely high levels of borrowing and spending, we must not – for our children’s sake – throw caution to the wind."
The World in High Frequency
Pictures, charts are all via Macquarie Bank

Feedback
Thank you for subscribing to the Primary Dealer Review. If you have any feedback on the content or format, or have any questions, please email me directly at primarydealerreview@gmail.com and I will get back to you.
Legal Information and Disclosures
This weekly summary expresses the views of the author as of the date indicated and such views are subject to change without notice. The author has no duty or obligation to update the information contained herein. Further, the author makes no representation, and it should not be assumed, that past investment performance is an indication of future results.
Moreover, wherever there is the potential for profit there is also the possibility of loss.
This weekly summary is being made available for educational purposes only and should not be used for any other purpose. The information contained herein does not constitute and should not be construed as an offering of advisory services or an offer to sell or solicitation to buy any securities or related financial instruments in any jurisdiction. Certain information contained herein concerning economic trends and performance is based on or derived from information provided by independent third-party sources.
The author believes that the sources from which such information has been obtained are reliable; however, it cannot guarantee the accuracy of such information and has not independently verified the accuracy or completeness of such information or the assumptions on which such information is based.
This weekly summary, including the information contained herein, may not be copied, reproduced, republished, or posted in whole or in part, in any form without the prior written consent of the author.