Retail Spending Up as Stimulus Checks Arrive
Weekly Macro Summary 2/21/21
THIS IS NOT INVESTMENT ADVICE.
Please speak with a registered investment advisor or other qualified financial professional before making any investment decisions.
What you need to know in 60 seconds
Retail spending up as stimulus checks land, and e-commerce continues it’s rapid expansion (15.5% of total consumer spend now, up from 12.9% pre-COVID)
Housing: Home renovation spending up, building permits up, prices up - the housing market shows no signs of slowing down
Central banks: Steady as she goes as we wait for inflation to kick in
Stocks: 79% of reporting stocks have had a positive earnings surprise
What we’re wondering: When will the rise in the US 10-year yield (1.35%) matter for equity markets? See FIXED INCOME, CURRENCIES, COMMODITIES, & EQUITIES in this weeks issue for what seems to be a reasonable guesstimate.
If you would like to receive the Weekly Macro Summary directly to your mailbox every Sunday, please subscribe. It’s free.
ECONOMIC DATA
The Atlanta Fed’s GDPNow forecast for Q1 growth is currently 9.5%
The New York Fed’s Nowcast forecast for Q1 growth is currently 8.3%
US Industrial Production +0.9% m/m in January, beats consensus expectation of +0.4%
Another strong month after December’s +1.3%m/m change
Manufacturing accounts for 75% of industrial production and was up 1%m/m. This is all a catch up to make up for lost production during COVID. Spending on goods has been above pre-COVID levels for several months (+5% as of December) but manufacturing production is still 1% below February 2020 levels.
US Manufacturing PMI 58.5, in line with expectations
Output to 57.7 from 60.5, new orders down to 57.3 from 59.9
Employment up slightly
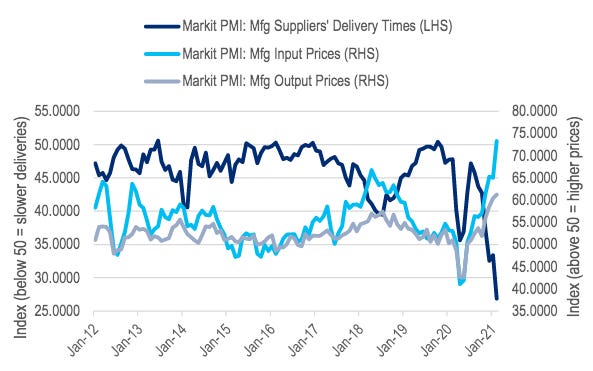
Supplier deliveries index at a record low of 26.8, indicating slow delivery times
Input and output price indices are at all time highs
US Producer Price Index (PPI) big upside surprise for January at +1.3% m/m vs. consensus +0.4%
Core +1.2%m/m versus +0.2% expected
US retail sales in January, +5.3% m/m, the largest monthly percentage rise in 9 months and well above the consensus. Stimulus checks began to be delivered in January and it looks like they had the desired impact
Every store type reporting gains and e-commerce saw an 11% rise, “Of every dollar spent at U.S. retailers in January, 15.5 cents was spent online; before the pandemic that share was 12.9 cents.”
Building materials & garden equipment +4.3% monthly gain. This is a proxy for home renovation spending. Now 20% higher than pre-COVID levels!
US Housing starts -6.0% m/m (1.58mln unit pace). Single-family starts -12.2% m/m, reverses a +12%m/m gain in December. Probable cause of the fall in single family was due to good weather in December that pushed starts forward, this was likely a reversion of that effect
December starts were revised up to 8.2% from 5.8% was upwardly revised from 5.8%, to 8.2%.
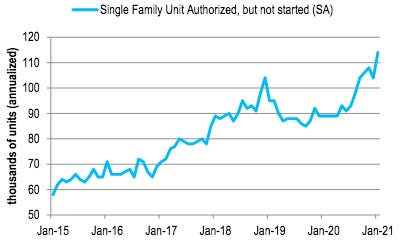
Building permits +10.4% m/m, to a 1.881mn unit pace vs. +4.2% in December.
Bottom Line: Building permits are now at their highest level since June 2006, that’s a better indication of what’s to come versus the housing starts data which can be noisy month-to-month. See home sales below.
US, existing home sales +0.6% m/m in January, beats expectations. This was the highest sales rate for January since 2005! Housing market continues to be one of the strongest ever
The median existing-home sales price: $303,900, +14.1% from a year ago
Housing inventory down to 1.04mln units -25% y/y
At the current pace there is just 1.9 months supply of homes down from 3.1 a year ago
UK CPI inflation +0.7% y/y in January slightly higher than consensus of +0.6 % y/y
Core stays steady at +1.4% y/y
Euro area PMIs 48.1, in line with expectations and still below 50 which indicates contraction in activity
Manufacturing at 58 is now at a 3 year high, the weakness is being driven by service sector that is being held back because of COVID related restrictions.
Given the divergence we think manufacturing is the better indicator of what’s to come when restrictions are lifted. Expect there to be a significant catch up in services over the coming months
“One concern is the further intensification of supply shortages, which have pushed raw material prices higher. Supply delays have risen to near-record levels, leading to near-decade high producer input cost inflation. At the moment, weak consumer demand – notably for services – is limiting overall price pressures, but it seems likely that inflation will pick up in coming months.” -IHS
The February German ZEW economic sentiment survey up to 71 from 62 and beats expectations for 60.
“The financial market experts are optimistic about the future. They are confident that the German economy will be back on the growth track within the next six months...Consumption and retail trade in particular are expected to recover significantly, accompanied by higher inflation expectations” -ZEW
Australian monthly employment +29k, driven by 59k addition of full time jobs
Jobs are now just 64k (0.5%) below February 2020 pre-COVID levels 0.5%
CENTRAL BANKS
US Fed released minutes for last meeting and there were no surprises in the release
In line with Chair Powell’s press conference responses after the meeting
Regarding fiscal support, participants at the meeting said that it had, “led them to judge that the medium term outlook had improved”
San Francisco Fed President Daly: “I am not thinking we have unwanted inflation right around the corner”
Boston Fed President Rosengren, “would be very surprised if we see a sustained inflation rate at 2% in the next year or two with labor markets as disrupted as they have been”
“[asset purchases] will continue until there is substantially more progress in lowering unemployment and raising inflation”
Richmond Fed President Barkin, “we plan to stay the course on asset purchases until substantial further progress is made to our goals”
New York Fed PresidentWilliams, “wait and see mode” + “not concerned about stimulus being excessive right now”
ECB released minutes for their last meeting, “some Governing Council members thought the intensification of the pandemic posed some downside risks to output in the first quarter of 2021”
Measures put in place in December were appropriate in view of the current outlook. General council reiterated its commitment to maintain a steady presence in markets to ensure accommodative financial conditions. also highlighted the commitment to maintain a steady
Regarding the euro’s recent strength, the GC noted that the nominal effective exchange rate was at historically high levels and had already had a negative impact on inflation
FIXED INCOME, CURRENCIES, COMMODITIES, & EQUITIES
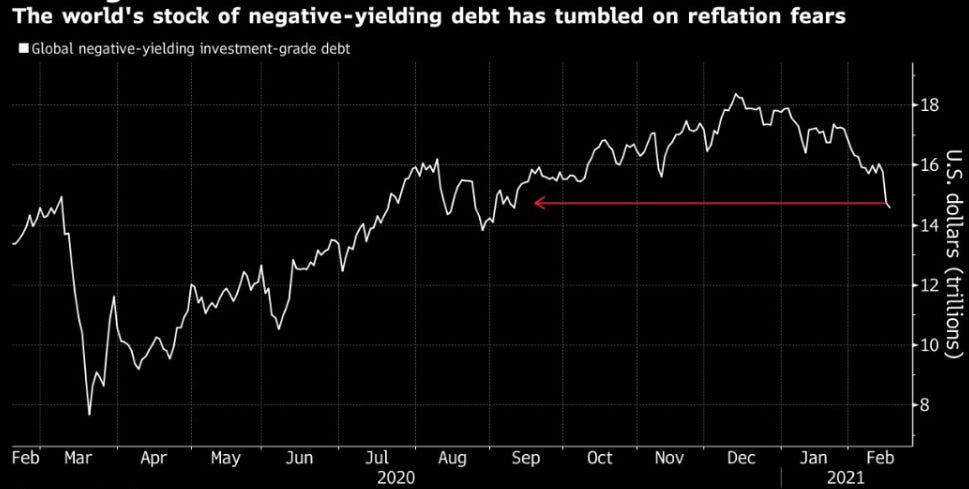
10 Year US Treasury yields have risen approximately 40 basis points year to date and are 1.35%. Despite the rising rate environment, the S&P500 is up 4%, the Nasdaq is up 5.5% and the Russell 2000 is up nearly 15%. This leads us to wonder, at what level of 10 year rates will the stock market begin to react? Strategists from Citi and Bank of America have tackled the question over the past several weeks using different methodologies. Each of these thought experiments independently arrived at a similar rate, approximately 1.70%.
In 2018, it was an approximate 50 basis point rise in real yields, from their trough, that triggered equity markets. Assuming a 2.25% breakeven inflation rate, that would get us to approximately 1.7% on the 10 year in 2021
As of February 8th, 70% of S&P 500 stocks sported a dividend yield above the 10 year yield. 1.70% is the approximately the rate at which less than half of S&P components’ yields would be higher than the 10 year.
Since 2008 periods of sustained market turbulence have coincided with the nominal 10 year yield rising above the blended cost of the US’s debt. The relationship is not immediate but it has served as a rough warning signal for when things start to get tricky for equities. Today’s blended cost of debt: 1.7%.
Via Factset: 83% of the S&P 500 components have reported earnings for Q4'2020
79% of companies have reported a positive EPS surprise thus far, and the overall growth rate for earnings has been 3.2%. Of companies that have provided earnings guidance, 63% have issued positive guidance. This compares favorably versus a 5-year average of 33% issuing positive guidance.
77% have reported a positive revenue surprise with an aggregate revenue growth figure of 3%
Legal Information and Disclosures
This weekly summary expresses the views of the author as of the date indicated and such views are subject to change without notice. The author has no duty or obligation to update the information contained herein. Further, the author makes no representation, and it should not be assumed that past investment performance is an indication of future results.
Moreover, wherever there is the potential for profit there is also the possibility of loss.
This weekly summary is being made available for educational purposes only and should not be used for any other purpose. The information contained herein does not constitute and should not be construed as an offering of advisory services or an offer to sell or solicitation to buy any securities or related financial instruments in any jurisdiction. Certain information contained herein concerning economic trends and performance is based on or derived from information provided by independent third-party sources.
The author believes that the sources from which such information has been obtained are reliable; however, it cannot guarantee the accuracy of such information and has not independently verified the accuracy or completeness of such information or the assumptions on which such information is based.
This weekly summary, including the information contained herein, may not be copied, reproduced, republished, or posted in whole or in part, in any form without the prior written consent of the author.


