Reddit meets Wall Street: The end of information asymmetry?
Weekly Macro Summary 01/31/2021
THIS IS NOT INVESTMENT ADVICE.
Please speak with a registered investment advisor or other qualified financial professional before making any investment decisions.
Commentary
“Upcrash. A gain so fast and rapid, that it might previously have been thought to be impossible. And it is, weirdly, kind of a crash. I mean, whoever heard of the SEC putting out a statement on market volatility because stocks were going up too much? Whoever heard of hedge funds having to quickly reduce their overall market exposure because some stocks were doing too well? It's new and weird!” -Joe Weisenthal, Bloomberg
Last week was one for the history books. It may have marked the culmination of a frenzy of activity, instigated by a reddit forum, that has driven some of the most heavily shorted individual stocks higher this year. Gamestop, the most followed of the stocks, finished the month of January up 1,625%. Meanwhile, the major equity indices all finished this past week lower by 3% and the benchmark for volatility, VIX index, rose from 21 to 33. Despite the broader equity sell-off and the pursuant reduction in risk exposures by market participants, US Treasury yields finished the week largely unchanged; an uncharacteristic outcome for the safe haven asset that typically rallies substantially during periods of market volatility and dislocation. While high flying meme stocks captured the world’s attention, The IMF upgraded its 2021 forecast for world growth upward to 5.5% from 5.2%. They see US economic growth at 5.1%. In October they had forecast 3%. Wall Street’s consensus for the US is approximately 4%. If the IMF’s new forecast turns out to be accurate it will mark the strongest growth for the US since 1984!
Chart of the Week
If you would like to receive the Weekly Macro Summary directly to your mailbox every Sunday, please subscribe. It’s free.
ECONOMIC DATA
US GDP for Q4’20 printed +4% q/q annualized, slightly weaker than expectations but significantly lower than the Atlanta FED GDPNow tracker that was projecting 8%.
Personal consumption +2.5%, thanks to strength in services but it was softer than expected given expectations of pent-up demand as a result of excess savings throughout the year for the holiday season.
The personal savings rate rose to 13.7% in December. Estimates are that a return of the savings rate to Q4’19 levels over the course of 2021 will add ~$1.1trln to consumption growth this year.
Fixed investment spending +18% led by residential investment (+33.5%), and business investment +13.8%. Rebuild of inventories added a full percentage point to the headline figure.
Bottom Line: GDP is below trend and output is significantly below the high water mark of Q4’19. While there may be a pickup in inflation pressures this year as a result of temporary disruptions caused by COVID, they will be transitory. There’s a significant amount of slack in the economy relative to the pre-COVID trend which gives the Fed significant cover to be patient in removing accommodation.
US durable goods orders +0.2% in December, weaker than expected but 8th consecutive monthly increase. The miss was largely because of transportation which fell 1% but excluding transportation, orders were up 0.7% (versus +0.5% expected) and are now above pre-COVID levels.
November orders were bumped up to a 1.2% from +1.0%.
Shipments +1.4% versus the prior 0.4% increase.
“With money not spent on travel, consumers have instead been spending on durable goods. An unwinding of this dynamic is a potential headwind for manufacturing this year, although we expect that to be more than offset by the positive effects from the reopening of the economy once vaccinations return economic activity to something closer to normal.” -Wells Fargo Economics
Dallas Fed Manufacturing General Business Activity Index for Jan fell 3.5 points, to 7.0. Street was expecting a 2 point rise.
The production index fell from 26.8 to 4.6; 13 of 17 indices for current conditions fell month over month.
Prices paid index up to 55 from 50.8, the highest level since 2011.
While the level still indicates growth, it is the lowest level since Aug.
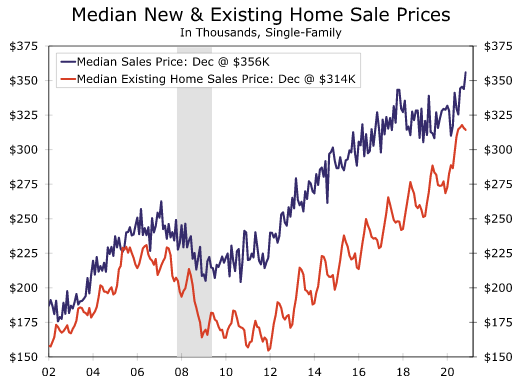
The S&P CoreLogic Case-Shiller National Home Price Index +9.5% for the year ending Nov 2020. Highest annual growth rate for home prices since 2014.
New home sales for Dececember came lower than expected, +1.6% m/m (3.5% expected). 842k unit pace.
The median sales price +3.5% m/m (+8% y/y) to $355,900.
Supply of homes slightly increased from 4.2 to 4.3 months but the increase was all the result of homes still under construction or homes where construction has not yet started. Completed home inventory is at an all-time low.
Overall sales for 2020 concluded at 811,000 units, an 18.8% gain versus 2019 and the highest total for any year since 2006!
CENTRAL BANKS
On Wednesday the Fed left monetary policy unchanged, as expected. There were no consequential changes to the FOMC statement. In his press conference, Chairman Powell reiterated that the Fed has not yet even begun to consider removing accommodation from the economy.
One sentence was added to the statement recognizing the recent slowdown in activity as a result of COVID, “the pace of the recovery in economic activity and employment has moderated in recent months, with weakness concentrated in the sectors most adversely affected by the pandemic.”
Why does this matter? The most recent virus case surge is moderating and some states are re-opening. Some high frequency consumer data is showing a pickup in activity. There’s a chance that the minor changes by the Fed could be a precursor to larger changes in their tone when vaccine roll-out and the resulting return to normalcy picks up. That was expected to reach critical mass in the spring but most projections now think summer is the base case. We are keeping an eye out for an upgrade to the Fed’s economic forecast in March.
FIXED INCOME, CURRENCIES, COMMODITIES
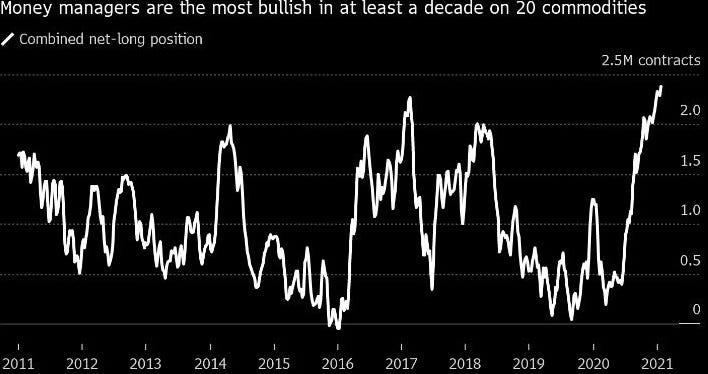
Prices for commodities are surging. From aluminum (+39% since March) to scrap steel (up 60% since November) to corn (up 43% since Aug). Having been underweight the sector for much of the past couple of years, Fund managers have chased the performance higher and now have their highest exposure to the sector in over 10 years.
The cause of rising commodity prices are the COVID related supply chain disruptions (factories shut, transportation disrupted) that were not met with a subsequent fall in demand for many commodity intensive products (cars, home appliances, furniture, etc).
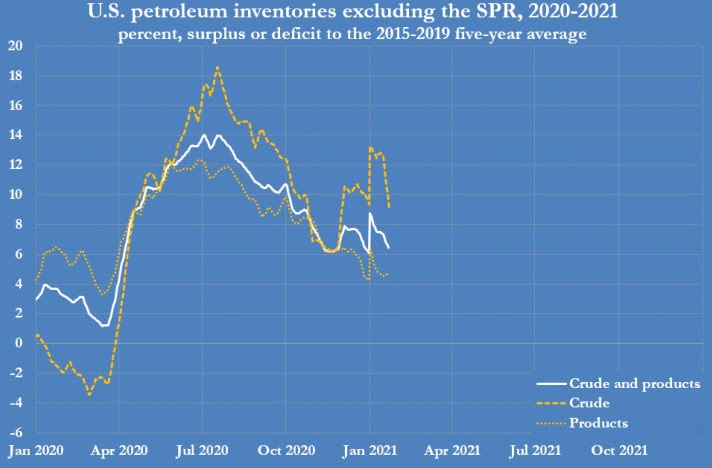
US petroleum total stocks of crude oil and products, excluding the strategic petroleum reserve, fell by 12 million barrels last week. They are now down 130 million barrels since the middle of 2020 and have fallen in 24 out of the last 30 weeks.
Petroleum inventories are now 6% above the pre-pandemic five-year average, this is down from their June 2020 high of 14% while crude oil inventories are now 9% above the average versus the high of 19%.
EQUITIES
According to Dealogic, US listed companies have done 80 follow-on equity offerings for $16.4bln through January 22. That’s the most raised for follow-ons through this time of year since Dealogic began tracking the data in 1995. It’s a symptom of the seemingly insatiable demand investors have had for equity offerings.
Last year there were 862 follow-on equity offerings that raised $257bln; a single year record.
The IPO market was just as hot. In 2020 there were 454 initial offerings that raised $167bln, beating the record from 1999 for the most ever in one year. Of the $167bln, $82bln were raised by SPACs (We touched upon the SPAC boom in our January 9th summary).
The raising is not limited to just equities. High-yield bond issuance reached $40.3bln so far for January, already more than any other January in history.
Last week was the 6th busiest on record for high yield; there were 20 deals worth $16.4bln
Goldman Sachs’s basket of the 50 stocks with the highest short interest were up 25% year-to-date, through Jan 22nd. Last week, things went ballistic: the 100 most heavily shorted stocks averaged a gain of 22.6% and are now up 70% year to date, according to Dow Jones. The median S&P 500 stock has just 1.6% of its market capitalization sold short, the lowest for the 16 years that Goldman has been measuring this metric.
Day traders, largely fueled by Reddit’s subreddit r/wallstreetbets, are also using options to drive up the shares of the heavily shorted stocks that still remain.
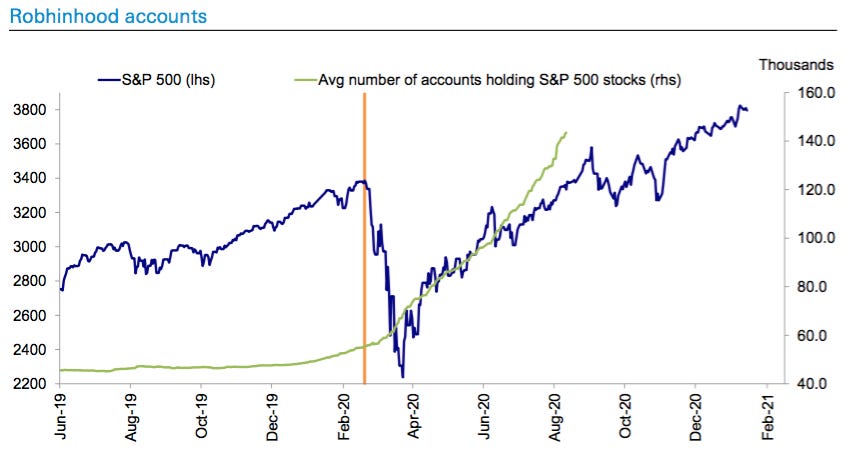
To put the size of the retail trading community in perspective, consider that Charles Schwab had 30 million active brokerage accounts as of the end of 2020 and ETradeadded 900k accounts in 2020. The number of users at r/wallstreetbets grew from 2.8mln to ~6mln by Friday morning.
Retail order flows accounted for 20% of total stock market volume in 2020, up from approximately 10% in 2010. The average daily number of retail trades at ETrade in 2020 was 952k, triple the previous high.
This past week saw an especially large surge in retail trading. The frenzy caused trade delays or outages at Fidelity, ETrade, Schwab, Vanguard, and Robinhood. More than 24bln shares traded in the US on Wednesday, the most ever for a single day (the previous high was in October 2008) and a record 57mln options contracts were traded.
“What is happening to the equity market this week is purely technical as all of a sudden short interest has been the only factor that has mattered to stock performance. Broadly, high profile short squeezes have caused some degree of a cascading effect of covering heavily shorted names across the index, and selling consensus longs as some market participants are forced to de-lever, and many market participants are choosing to de-lever because they know that some will be forced to.” -Travis McCourt, Raymond James
“In our opinion, the market implication from this week’s events is not arising from the short covering on certain small stocks or potential losses inflicted on certain hedge funds, but more from a potential slowing of the overall retail flow that had been an important driver of the risk market rally since November. The sharp rise in volatility and margin requirements for stocks popular with retail investors could inflict losses on the same retail investors that have been profiting from the positive momentum of the previous weeks” -JP Morgan Global Quantitative and Derivatives Strategy
Jefferies Retail Speculative Index
Why did Sears and Blockbuster soar this week, returning 40% and 1304%, respectively? Lily Francus, PhD Candidate in Bioinformatics at the University of California San Diego, dives into the behavioral aspects of the events that unfolded this week on her blog, “Nope, it’s Lily.”
“Associations can be made through time and space — There is no trivial way to map for instance, BLIAQ and GME. At least to a computer that is. In fact, it’s quite likely no post mentioned them together (pre-rally) in the same sentence online. This is a uniquely human phenomenon — we are designed to see patterns, even when the pattern may not exist. A savvy speculator can connect the dots here in ways that perhaps a computer can’t (at least not yet, to my knowledge).”
The semantic association between stocks, see semantic network, explains why the human mind tends to favor these well known brands. Regardless of their risk-return profile, companies in bankruptcy soared this week.
“A god meme, in this paradigm, is the epicenter of the narrative, which usually follows (or sometimes sets) a theme and starts the trend. Two fantastic and simple examples of the god meme are Tesla and Gamestop. In Tesla’s case, while cultural shifts towards ESG have been an undercurrent for years, Tesla’s rise as the reigning meme stock of 2020 dramatically accelerated the zeitgeist. Tesla effectively was the nuclear bomb which in its blast radius (success) led to cash inflows (and therefore price increases) throughout its semantic network, to varying degrees.”
While retail investors are amidst a buying frenzy, company directors are selling. Via Mark Hulbert, “The percentage of companies with any director or officer transaction in a given month in which there were more purchases than sales. For the month of January to date this proportion is just 10.8%. That’s the lowest level of the past decade.”
This is a little over 2 standard deviations below the 10 year average and something you’d only expect to see 2% of the time. For small-cap companies the data is more extreme where the figure shows that net buying is 3.4 standard deviations the 10 year average.
Around the March 2020 stock market lows, the ratio rose to an extreme high at 62.5%.
Ed Yardeni highlights that the S&P500’s forward P/E ratio has climbed 20% year-over-year to 22.7 as of January 21st. This is among the highest forward readings since March 2000.
“The forward earnings multiples on all of the S&P 500 sectors—except for Consumer Staples and Utilities—have expanded over the past year. Here are the S&P 500 sectors’ current forward P/Es and where they stood a year ago: Real Estate (53.5, 44.4), Consumer Discretionary (36.8, 22.5), Energy (27.8, 16.7), Information Technology (27.6, 22.8), Industrials (24.2, 17.4), Communication Services (23.3, 19.6), S&P 500 (22.7, 18.8), Materials (21.3, 18.0), Consumer Staples (20.1, 20.5), Utilities (18.8, 20.7), Health Care (16.9, 16.4), and Financials (14.3, 13.2).”
Royal Dutch Shell will purchase the largest public electric vehicle charging network in the UK, Ubitricity.
2700 charge points, which represents approximately 13% market share
In April 2018 we discussed, at length, the shifting strategy of big energy companies. Back then we made the following points:
With the growth of renewable energy and electric vehicles Big Oil companies are betting on electricity.
Oil majors are huge companies with massive balance-sheets. Customer-facing utilities are small by comparison. E.g. Centrica, the biggest of Britain’s Big Six, is worth $10.8bn while Shell’s market value is ~$260bn.
Utilities often operate in only one or two national markets and have to deal with onerous regulations.
[In Mar 2018] Shell completed the acquisition of First Utility, a midsized British gas and electricity supplier and have plans to do something similar in Australia.
In 2017 Total started to supply gas and green power to households in France [Total Spring].
Both companies have invested in renewable energy and are installing EV charging points in their gas stations.
Oil majors aim for returns on capital on big oil and gas developments of 15%, renewables provide returns of 7-9%. British energy retailers aim for profit margins of 4-5%.
Shell aims to generate electricity returns of 8-12%. How? Rely on energy trading experience to take advantage of higher volatility of power markets.
To become material to Shell, the electricity business would need to grow to $50bn-100bn [size of its current gas business].
So is it oil’s Eastman Kodak moment? Electrification is already causing upheaval.
“The challenge, as with Kodak, is whether you can spot where the returns will be.”
GM pledged this week to stop selling non-commercial gas and diesel cars by 2035.
GM expects that 40% of its lineup will be electric by 2025. It plans to launch 30 battery-only vehicles before 2025. It had previously announced plans to invest $27bln toward the development of EVs and self-driving vehicles in order to achieve these goals.
2020 was financially the worst year ever for airlines. Southwest Airlines had its first loss since 1972 having lost $3.1bln for the full year and $900mln in the fourth quarter alone. American Airlines suffered a $9bln loss for the year and $2.2bln in the fourth quarter.
With everything going in with some smaller stocks that have captured the crowd's attention it's easy to forget that we are in the middle of earnings season. So far, 37% of S&P 500 companies have reported results for Q4.
82% of have beat their EPS estimates (versus a 5 year average of 74% beat rate).
Companies have reported earnings that are 13.6% above what was forecast, twice the historical average.
To date, earnings have declined 2.3% y/y from Q4'19 to Q4'20.
Revenues have also been remarkably strong. 76% of companies that have reported so far have beaten estimates (5 year average beat rate is 62%). And, in aggregate, revenues have come in 3.2% ahead of expectations and they are actually up 1.7% year-over-year for Q4'20.
The coming week will be the busiest of earnings season with 110 S&P 500 components scheduled to report their results.
Johnson & Johnson (Ticker: JNJ): Reported Q4 earnings on Tuesday morning. The stock ended the week down a little over 1%
4Q Sales came ahead of estimates at +3.7% with Pharma’s group +7%; Consumer sales increased a modest 1.4%.
EPS grew 2% but largely as a result of a reduced tax rate
Medical-Device Sales Were Flat vs. Q4’19, But Pharma Was Up 16%
3M (Ticker: MMM): reported earnings before the bell on Tuesday. Organic sales rose 5.5% in 4Q, and full year sales fell only 1.7% (better than expected)
Transportation & Electronics Turn Positive, Up 1.4% in 4Q, Yet Virus-Affected Businesses Still a Risk.
3M Increased Respirator Production Fourfold With Capacity to Build 2.5 Billion Units Annually.
Advanced Micro Devices (Ticker: AMD): Adjusted EPS beat expectations at $0.52 vs the consensus of $0.47.
Revenue finished the quarter up 3.244B vs the streets estimate of 3.028B.
Continuing expansion in server CPU share, a favorable PC backdrop and a gaming console refresh cycle could push AMD sales higher than its guided 37% growth in 2021.
“Our 2021 financial outlook highlights the strength of our product portfolio and robust demand for high-performance computing across the PC, gaming and data center markets”
Microsoft (Ticker: MSFT): Adjusted EPS for the quarter was $2.03 vs the streets estimates of $1.65.
Adjusted Net Income beat expectations of $15.5bln vs consensus of $12.44bln.
Sales increased 15% to $43.1bln driven by demand for cloud services
LinkedIn Sales +22%, Driven by advertising demand and the company’s marketing solutions unit.
Gaming continued its strong performance driven by stay at home trends +50% driven by Xbox hardware sales
Boeing (Ticker: BA): reported Q4’20 earnings before the bell on Wednesday. The stock ended the week at 194.19, down almost 5% from the previous week.
Adjusted EPS of -$4.175 vs consensus -$2.11, net Income -$2.4bln vs -$1.4bln estimated. The company took a surprise $6.5bln charge related to its 777X program. This is Boeing’s newest model 777. The first delivery is expected to be in 2023, before the pandemic first deliveries were expected this year.
Boeing Cash Burn Dropped to $4.3 Billion, From $5.1 Billion in Q3.
Commercial Revenue Fell 37% vs. Q4’19, to $4.7 Billion, on 59 Deliveries; Adjusted Operating Loss Improved to $700 million.
Apple (Ticker AAPL): reported strong Q1’21 results. EPS 1.68 vs 1.42 consensus.
Apple's 17% growth in iPhone sales in Q1 was aided by more unit shipments and a richer mix.
Services, the other key growth and margin vector, posted 24% growth.
China’s 57% growth shows its pent-up demand for 5G iPhones and its wide 5G infrastructure availability. We expect U.S. Q1 growth of 12% to accelerate. Our scenario sees sales of $341 billion in 2021 with $65 billion from services sales, 40% gross margin and $4.72 in EPS. - Anand Srinivasan, Senior Analyst at Bloomberg
Tesla (Ticker: TSLA): reported Q4’20 earnings on Wednesday.
Adjusted EPS came in lower than expected at 0.8 vs 1.026 estimated. The miss was largely a result of Q4 gross margins which fell to 20.7% from 24% in Q3.
Regulatory Credit Revenue accounted for 70% of Q4 Operating Income. For the full year 2020, Tesla generated $1.6bln in revenue selling these credits.
Production for Models 3 and Y Surges 90% Year-Over-Year as Models S and X Go in Reverse.
Revenue Surpasses $10 Billion threshold for First Time.
TE Connectivity (Ticker: TEL) an industrial components supplier whose sensors and connectors are used in a wide range of products, from automobiles to medical devices, reported sales of $3.5bln for Q4, up 11% y/y and ahead of analyst estimates for $3.3bln.
Adjusted EPS $1.47 versus $1.29 conesusus
Approximately 65% of TE's sales come from transportation end markets and TE said it expects global car production in 2021 to remain below 2019 levels.
The company did not provide full year guidance due to uncertainty associated with the economic recovery.
GEOPOLITICS
President Xi Jinping has long led an anti-corruption campaign, paying special attention towards China’s financial systems believed to be a threat to its economic stability. The latest casualty was Lai Xiaomin, head of Huarong Asset Management, who was executed following a corruption conviction by the city of Tianjin.
He was found guilty of taking bribes over the course of 10 years in the amount of approximately Rmb1.8bln, or roughly $280mln, causing “serious losses to the interests of the nation.”
“Verdicts such as that handed down to Lai should be considered “political determinations'', given China’s judiciary functions to serve the interests of the Chinese Communist party … It is unclear whether he had access to counsel of choice, whether he had access to family members, whether he had access to the evidence as presented against him — this is a government that still has something like a 99% conviction rate.” - Sophie Richardson, China head of Human Rights Watch
“China executed 2,000 people in 2018, by far the most in the world, down from 5,000 in 2010 and 12,000 in 2002, according to estimates from Dui Hua Foundation, a rights group.”
German payment processor and financial services company, Wirecard, announced last year that €1.9bln went missing from its accounts and quickly declared insolvency. Creditors were defrauded of approximately €3.2bln. BaFin, Germany’s financial regulator, has fallen under fire ignoring the early red flags associated with Wirecard’s fraud. Heads Felix Hufeld and Elisabeth Roegele have been dismissed.
After initial acknowledgement of ineffective handlings, Felix Hufeld, head of Bafin at the time, retconned his statements and defended BaFin’s handling of the affairs.
It has also come to light that a BaFin employee has also been accused of insider trading with Wirecard shares around the time the fraud allegations came to light in June of 2020.
After continual regulatory failures at BaFin despite organizational changes, Hufeld has been dismissed alongside his deputy Elisabeth Roegele, who was dismissed for her part in the ban of short-selling Wirecard shares. This move followed BaFin’s roundabout suggestion that Wirecard was the victim of short sellers and not their balance sheet discrepancy.
PUNDITRY
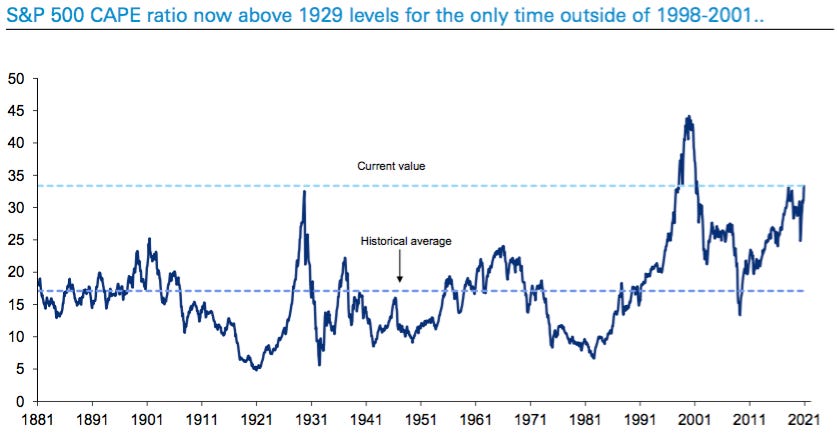
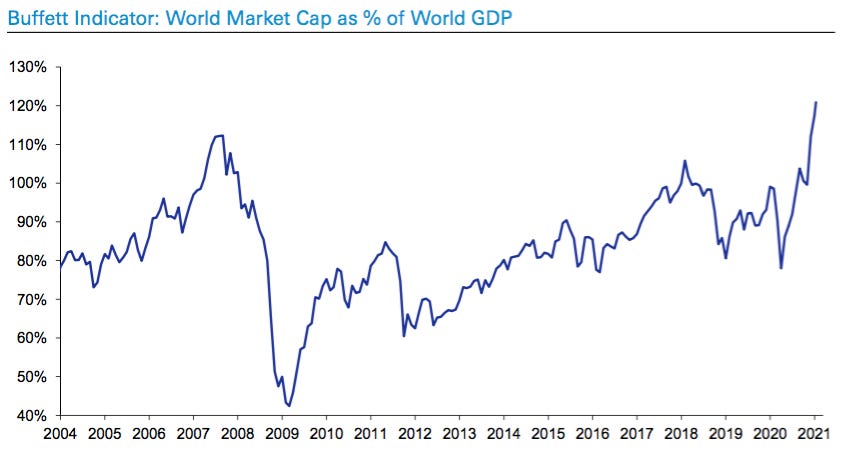
Deutsche Bank asks, “Is there a bubble in financial markets?”
“No doubt that in aggregate US equity valuations are at, or close to, all time highs..”
“Excess equity yield doesn’t suggest as strong an overvaluation… or is it only relative not absolute?”
“Low yields justify higher valuations... but how high???”
For now funding costs and financial conditions are extremely accommodative supporting all risk assets….
“Little doubt central banks have helped pushed markets higher, especially since March... but the trend was there pre- pandemic.…”
Equities very ‘cheap’ vs bonds outside of the US
Volume of global negative yielding debt close to record highs….
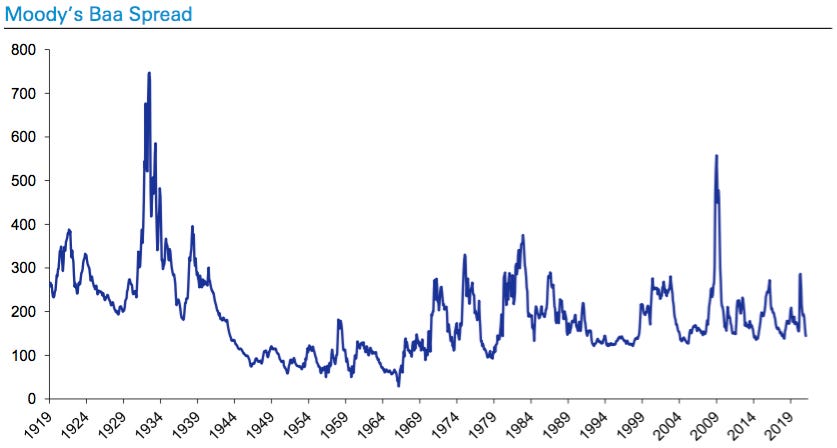
Credit spreads tight but they typically spend long periods very tight before intense spikes higher in recessions/crises....
10 Mega-cap growth stocks (c.30% of S&P 500) propelling market in recent years. Other 490 only just ahead of Stoxx 600 over last 6 years….
Tesla’s rise remarkable.... Is it justified? Is Tesla a sign of bubble like tendencies in “growth” US equities? Or the start of a new era? It is now in top 6 biggest companies in the world and c.80% the size of the entire US, EU and Japanese Auto markets (ex Tesla).
Sign of the times... a very small Texan healthcare company went from a $7mn company to nearly a billion dollar company in 36 hours of trading on the back of one misinterpreted tweet.…
And then there’s the, “other” Zoom
The return of retail... good or bad news? Will next stimulus checks increase this further?
Valuations are extremely high regardless of measure….
Feedback
Thank you for subscribing to the Primary Dealer Review. If you have any questions or comments, please email me directly at primarydealer@weeklymacro.com and I will get back to you.
Do you know someone who would like to receive this publication? Please feel free to share the Weekly Macro Summary with them.
Legal Information and Disclosures
This weekly summary expresses the views of the author as of the date indicated and such views are subject to change without notice. The author has no duty or obligation to update the information contained herein. Further, the author makes no representation, and it should not be assumed that past investment performance is an indication of future results.
Moreover, wherever there is the potential for profit there is also the possibility of loss.
This weekly summary is being made available for educational purposes only and should not be used for any other purpose. The information contained herein does not constitute and should not be construed as an offering of advisory services or an offer to sell or solicitation to buy any securities or related financial instruments in any jurisdiction. Certain information contained herein concerning economic trends and performance is based on or derived from information provided by independent third-party sources.
The author believes that the sources from which such information has been obtained are reliable; however, it cannot guarantee the accuracy of such information and has not independently verified the accuracy or completeness of such information or the assumptions on which such information is based.
This weekly summary, including the information contained herein, may not be copied, reproduced, republished, or posted in whole or in part, in any form without the prior written consent of the author.


